| __timestamp | Trane Technologies plc | Waste Connections, Inc. |
|---|---|---|
| Wednesday, January 1, 2014 | 12891400000 | 2079166000 |
| Thursday, January 1, 2015 | 13300700000 | 2117287000 |
| Friday, January 1, 2016 | 13508900000 | 3375863000 |
| Sunday, January 1, 2017 | 14197600000 | 4630488000 |
| Monday, January 1, 2018 | 15668200000 | 4922941000 |
| Tuesday, January 1, 2019 | 16598900000 | 5388679000 |
| Wednesday, January 1, 2020 | 12454700000 | 5445990000 |
| Friday, January 1, 2021 | 14136400000 | 6151361000 |
| Saturday, January 1, 2022 | 15991700000 | 7211859000 |
| Sunday, January 1, 2023 | 17677600000 | 8021951000 |
| Monday, January 1, 2024 | 19838200000 | 8919591000 |
Unlocking the unknown
In the ever-evolving landscape of industrial and waste management sectors, Trane Technologies plc and Waste Connections, Inc. have demonstrated remarkable revenue growth over the past decade. From 2014 to 2023, Trane Technologies saw its revenue increase by approximately 37%, while Waste Connections experienced an impressive growth of nearly 286%. This stark contrast highlights the dynamic nature of these industries and the strategic maneuvers each company has employed to capture market share.
These trends reflect broader economic shifts and the increasing importance of sustainable practices in business operations.
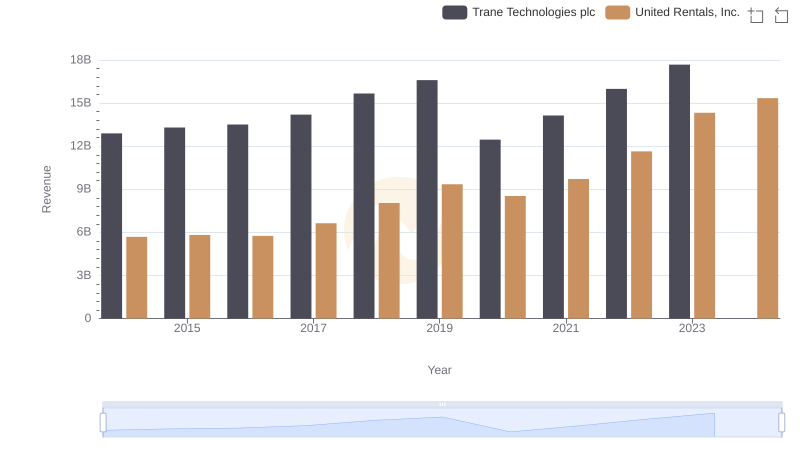
Who Generates More Revenue? Trane Technologies plc or United Rentals, Inc.
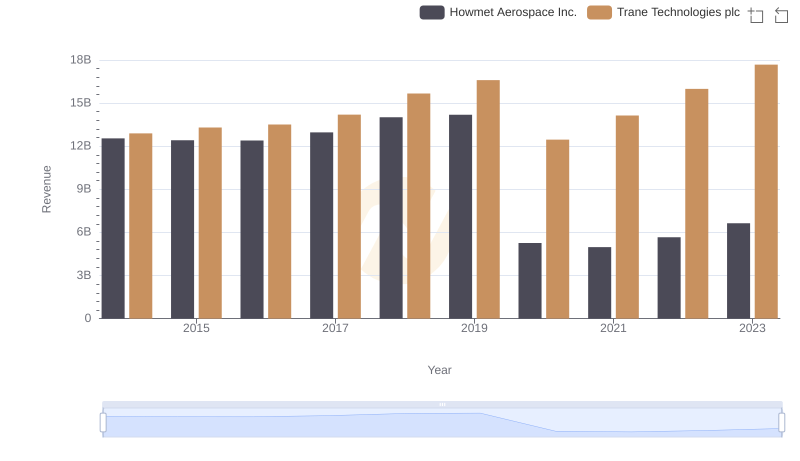
Breaking Down Revenue Trends: Trane Technologies plc vs Howmet Aerospace Inc.
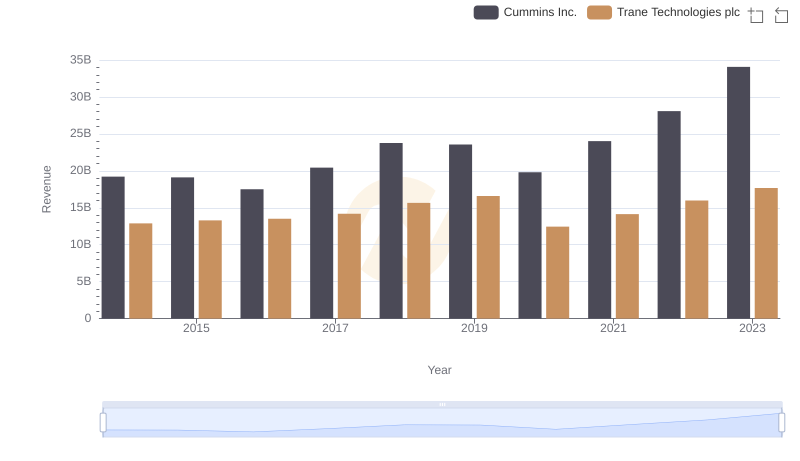
Revenue Showdown: Trane Technologies plc vs Cummins Inc.
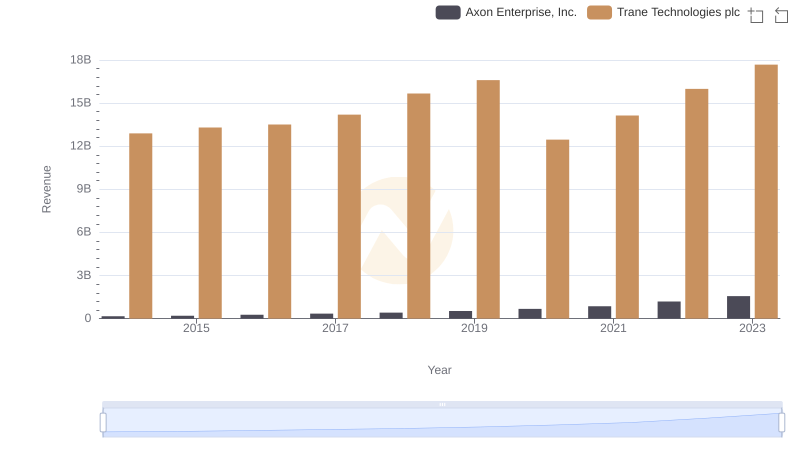
Revenue Showdown: Trane Technologies plc vs Axon Enterprise, Inc.
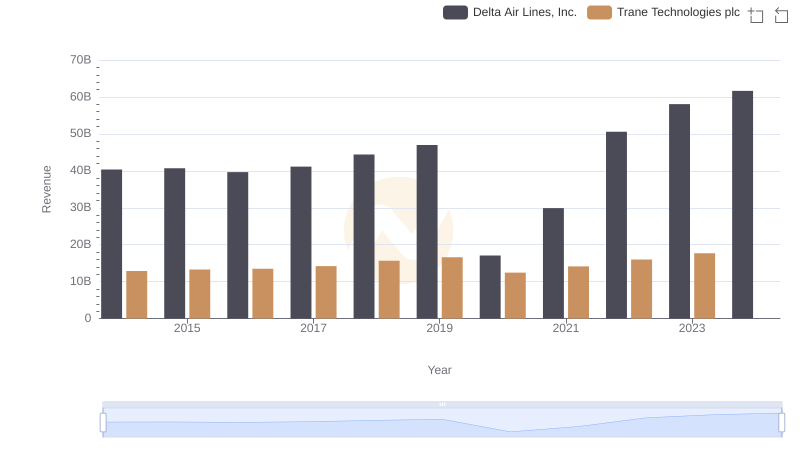
Who Generates More Revenue? Trane Technologies plc or Delta Air Lines, Inc.

Trane Technologies plc vs Fastenal Company: Annual Revenue Growth Compared
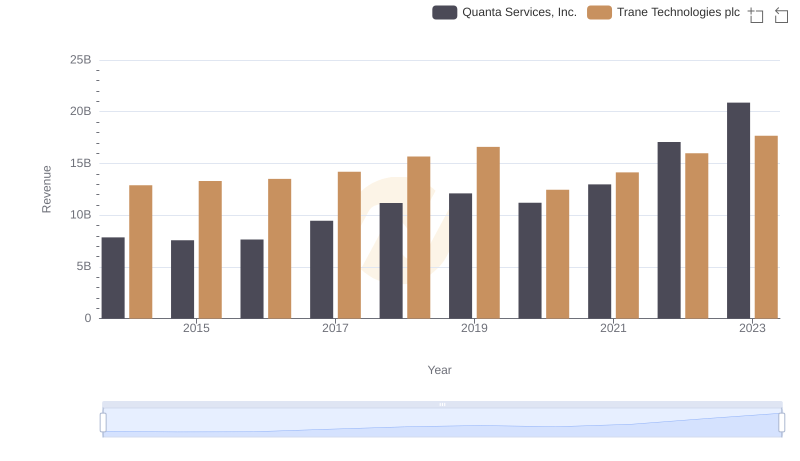
Annual Revenue Comparison: Trane Technologies plc vs Quanta Services, Inc.
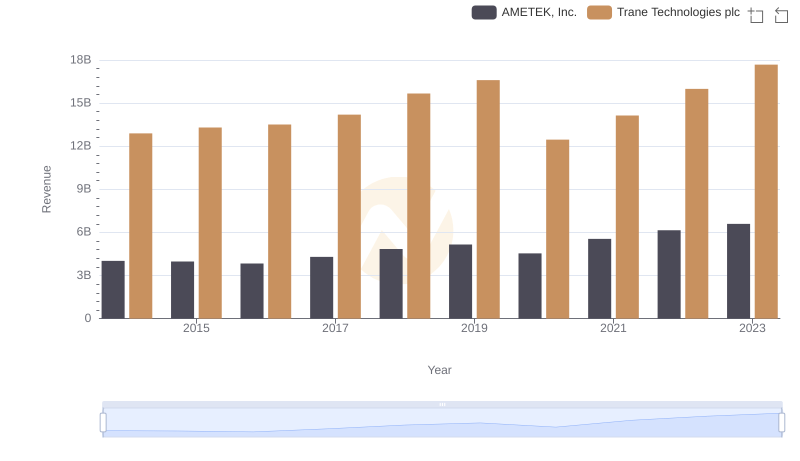
Trane Technologies plc vs AMETEK, Inc.: Annual Revenue Growth Compared
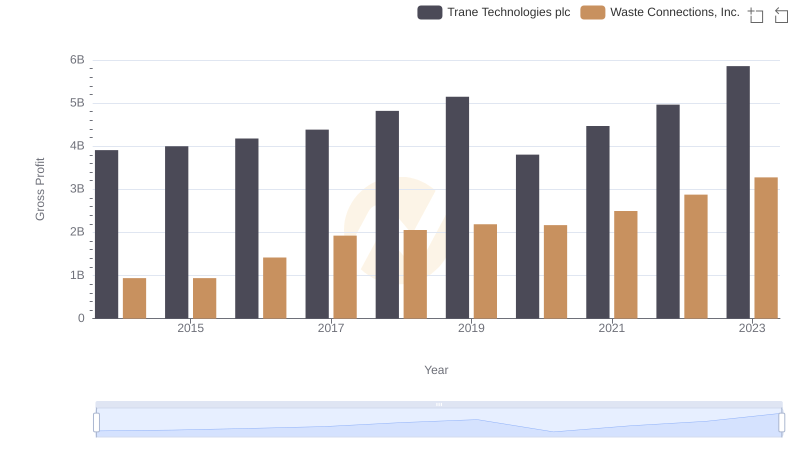
Gross Profit Comparison: Trane Technologies plc and Waste Connections, Inc. Trends
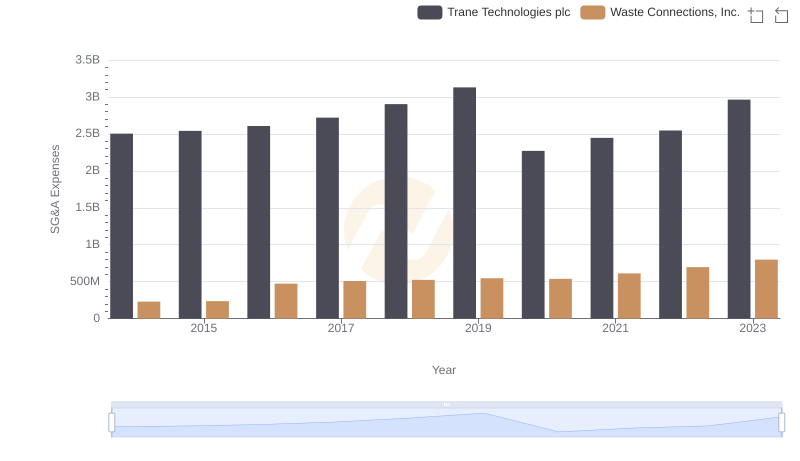
Cost Management Insights: SG&A Expenses for Trane Technologies plc and Waste Connections, Inc.
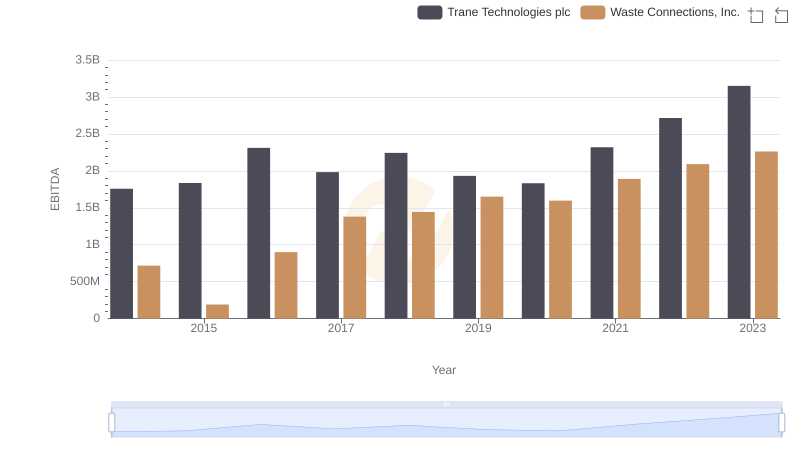
Trane Technologies plc and Waste Connections, Inc.: A Detailed Examination of EBITDA Performance