| __timestamp | Delta Air Lines, Inc. | Trane Technologies plc |
|---|---|---|
| Wednesday, January 1, 2014 | 40362000000 | 12891400000 |
| Thursday, January 1, 2015 | 40704000000 | 13300700000 |
| Friday, January 1, 2016 | 39639000000 | 13508900000 |
| Sunday, January 1, 2017 | 41138000000 | 14197600000 |
| Monday, January 1, 2018 | 44438000000 | 15668200000 |
| Tuesday, January 1, 2019 | 47007000000 | 16598900000 |
| Wednesday, January 1, 2020 | 17095000000 | 12454700000 |
| Friday, January 1, 2021 | 29899000000 | 14136400000 |
| Saturday, January 1, 2022 | 50582000000 | 15991700000 |
| Sunday, January 1, 2023 | 58048000000 | 17677600000 |
| Monday, January 1, 2024 | 61643000000 | 19838200000 |
Unleashing insights
In the ever-evolving landscape of global business, revenue generation is a key indicator of a company's success. This chart provides a fascinating glimpse into the revenue trends of Trane Technologies plc and Delta Air Lines, Inc. over the past decade. From 2014 to 2023, Delta Air Lines consistently outperformed Trane Technologies in revenue generation, with a notable peak in 2024, where Delta's revenue surged by approximately 52% compared to its 2014 figures. Trane Technologies, while showing steady growth, reached its highest revenue in 2023, marking a 37% increase from 2014. The data highlights the resilience of Delta Air Lines, especially post-2020, as it rebounded from the pandemic's impact. Meanwhile, Trane Technologies maintained a steady upward trajectory, reflecting its robust business model. Missing data for 2024 suggests a need for further updates to capture Trane's latest performance.
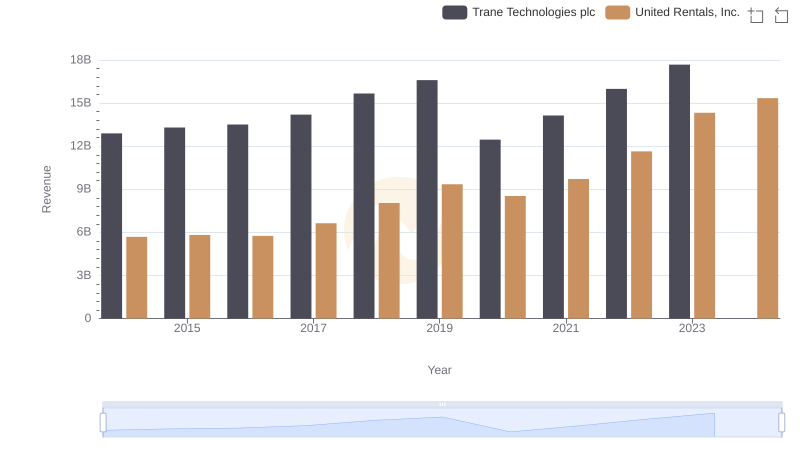
Who Generates More Revenue? Trane Technologies plc or United Rentals, Inc.
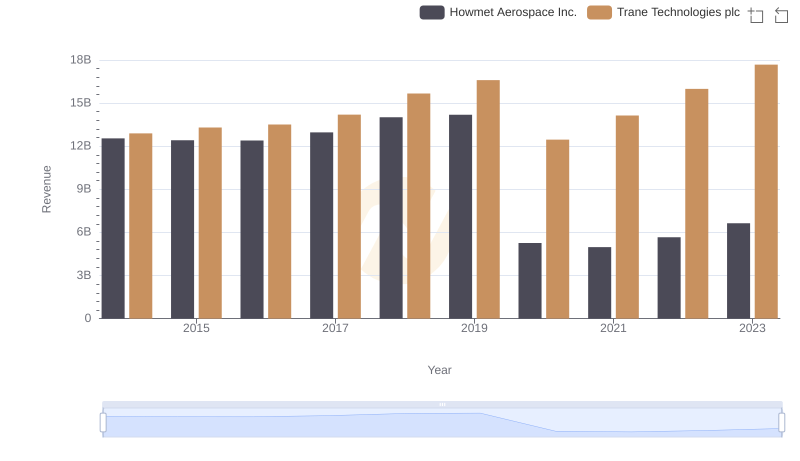
Breaking Down Revenue Trends: Trane Technologies plc vs Howmet Aerospace Inc.
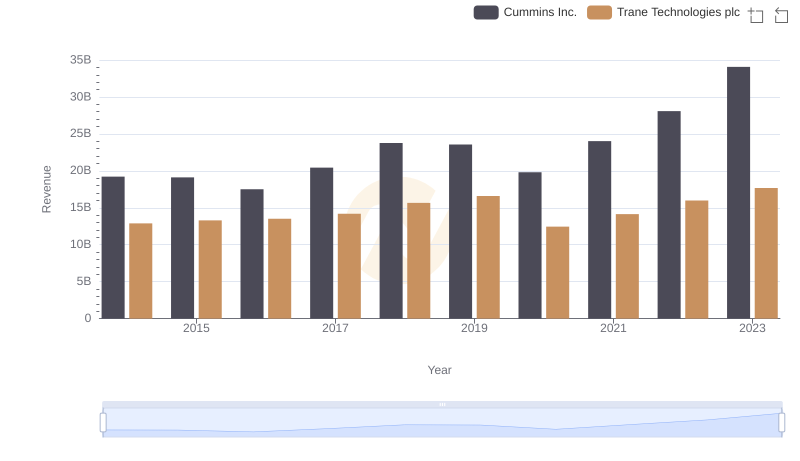
Revenue Showdown: Trane Technologies plc vs Cummins Inc.
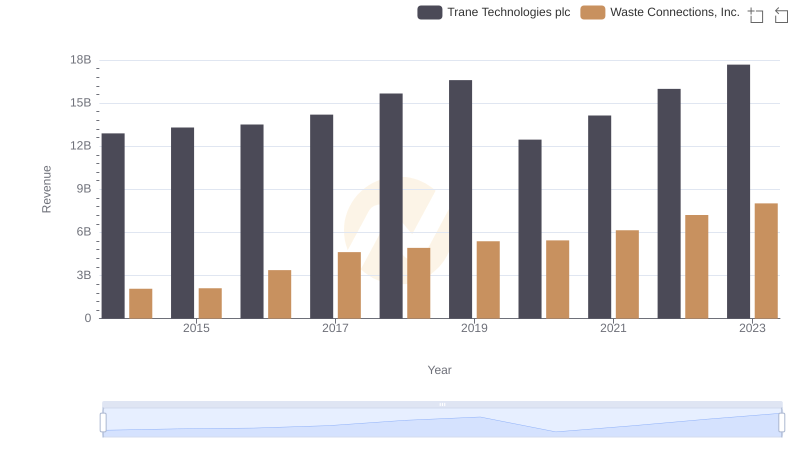
Trane Technologies plc vs Waste Connections, Inc.: Annual Revenue Growth Compared
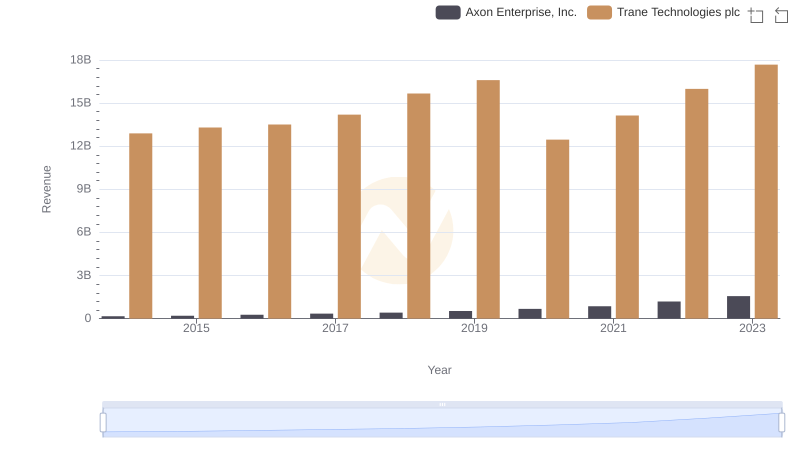
Revenue Showdown: Trane Technologies plc vs Axon Enterprise, Inc.

Trane Technologies plc vs Fastenal Company: Annual Revenue Growth Compared
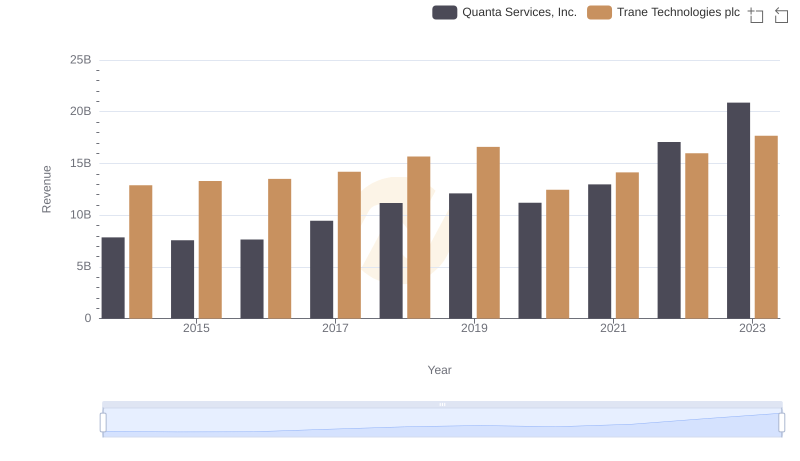
Annual Revenue Comparison: Trane Technologies plc vs Quanta Services, Inc.
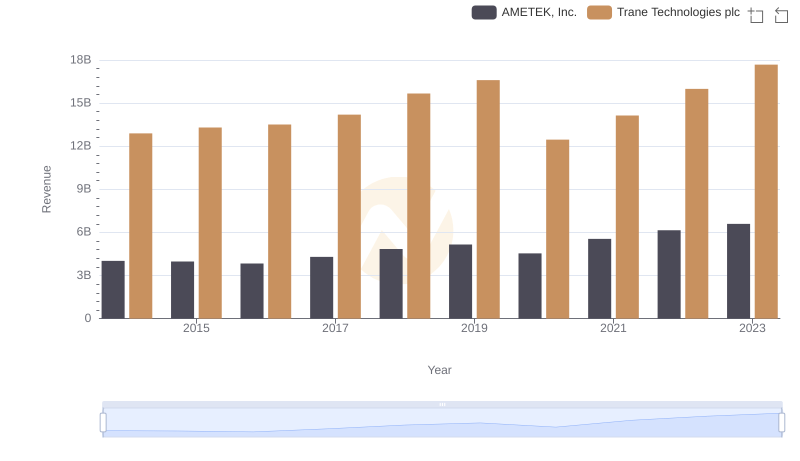
Trane Technologies plc vs AMETEK, Inc.: Annual Revenue Growth Compared
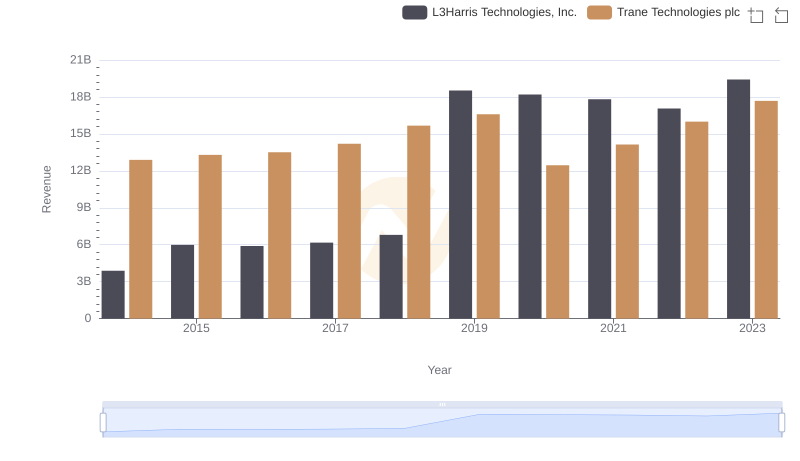
Trane Technologies plc vs L3Harris Technologies, Inc.: Examining Key Revenue Metrics
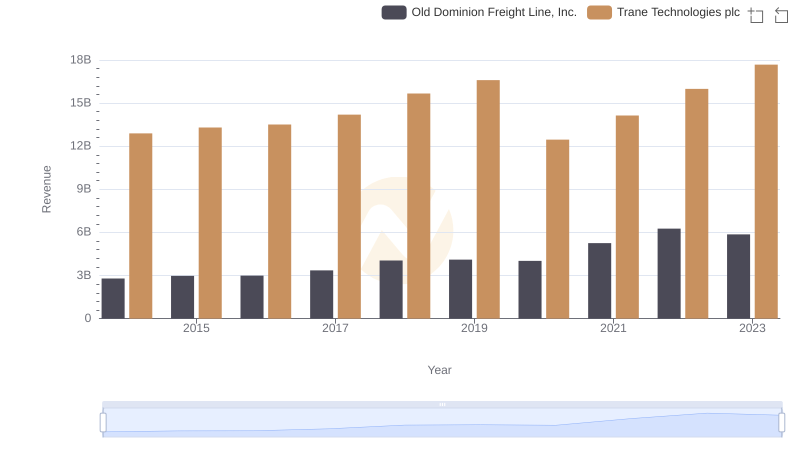
Annual Revenue Comparison: Trane Technologies plc vs Old Dominion Freight Line, Inc.
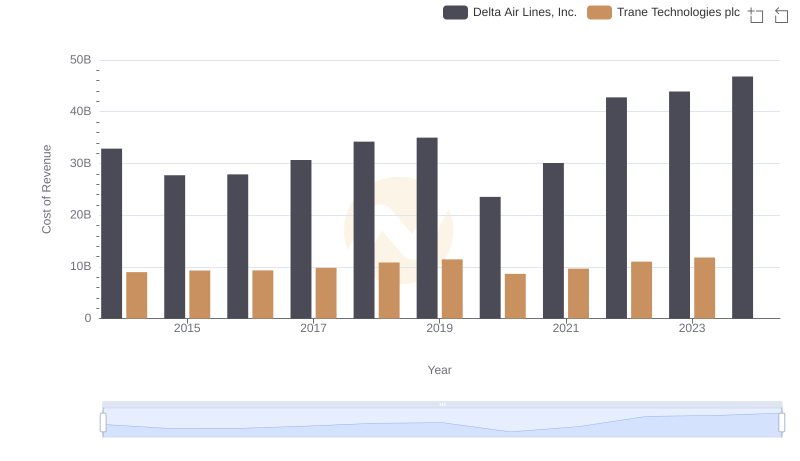
Analyzing Cost of Revenue: Trane Technologies plc and Delta Air Lines, Inc.
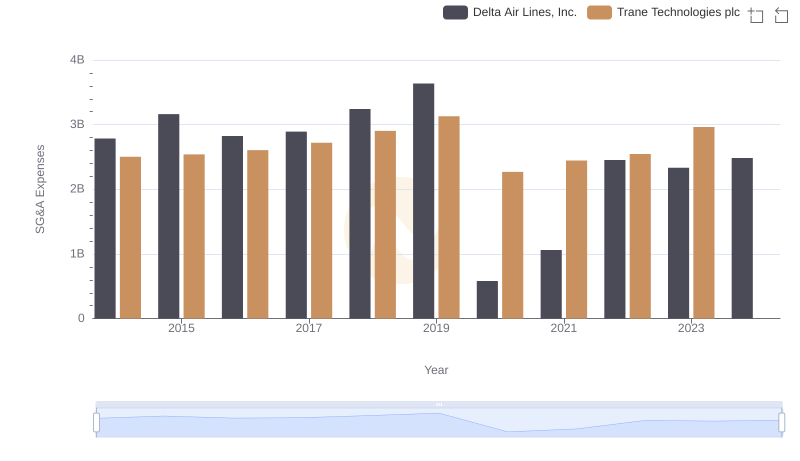
SG&A Efficiency Analysis: Comparing Trane Technologies plc and Delta Air Lines, Inc.