| __timestamp | Quanta Services, Inc. | Trane Technologies plc |
|---|---|---|
| Wednesday, January 1, 2014 | 7851250000 | 12891400000 |
| Thursday, January 1, 2015 | 7572436000 | 13300700000 |
| Friday, January 1, 2016 | 7651319000 | 13508900000 |
| Sunday, January 1, 2017 | 9466478000 | 14197600000 |
| Monday, January 1, 2018 | 11171423000 | 15668200000 |
| Tuesday, January 1, 2019 | 12112153000 | 16598900000 |
| Wednesday, January 1, 2020 | 11202672000 | 12454700000 |
| Friday, January 1, 2021 | 12980213000 | 14136400000 |
| Saturday, January 1, 2022 | 17073903000 | 15991700000 |
| Sunday, January 1, 2023 | 20882206000 | 17677600000 |
| Monday, January 1, 2024 | 19838200000 |
Unlocking the unknown
In the ever-evolving landscape of industrial giants, Trane Technologies plc and Quanta Services, Inc. have emerged as formidable players. Over the past decade, these companies have demonstrated remarkable revenue growth, reflecting their strategic prowess and market adaptability.
From 2014 to 2023, Trane Technologies saw its revenue grow by approximately 37%, starting from $12.9 billion and reaching $17.7 billion. Meanwhile, Quanta Services experienced an even more impressive surge, with revenue increasing by 166%, from $7.9 billion to $20.9 billion. This growth trajectory highlights Quanta's aggressive expansion and diversification strategies.
The data underscores the dynamic nature of the industrial sector, where innovation and strategic investments are key to staying ahead. As these companies continue to expand their footprints, stakeholders and investors should keep a keen eye on their evolving strategies and market positions.
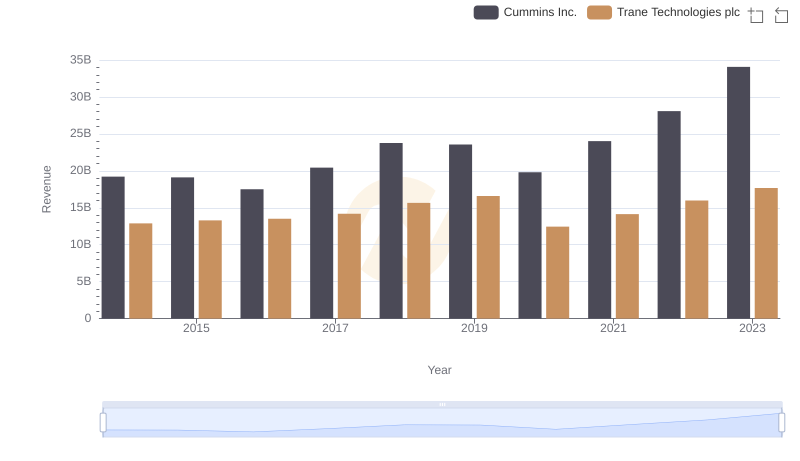
Revenue Showdown: Trane Technologies plc vs Cummins Inc.
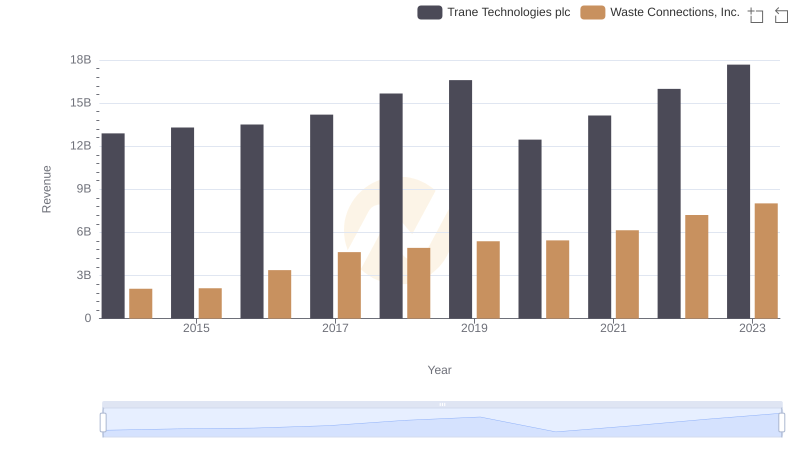
Trane Technologies plc vs Waste Connections, Inc.: Annual Revenue Growth Compared
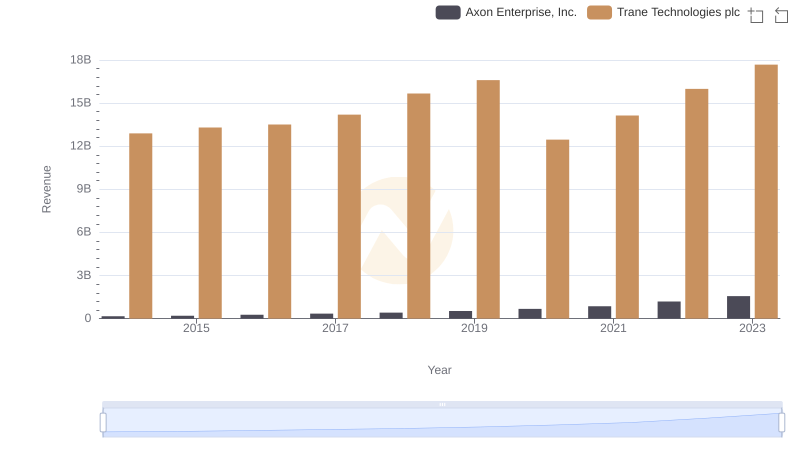
Revenue Showdown: Trane Technologies plc vs Axon Enterprise, Inc.
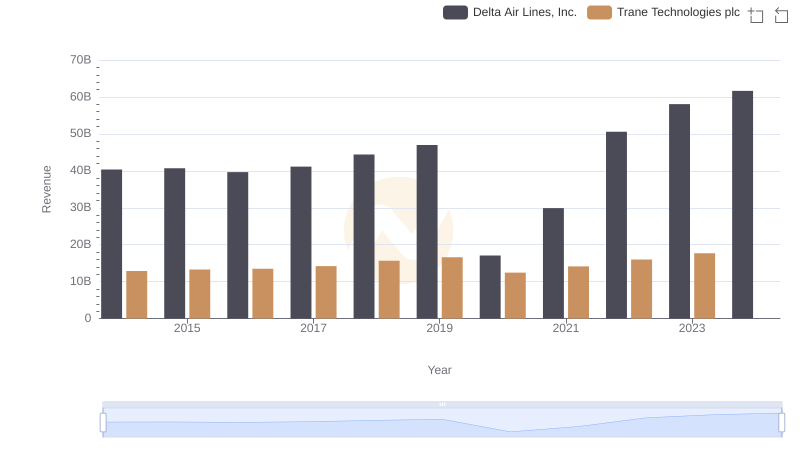
Who Generates More Revenue? Trane Technologies plc or Delta Air Lines, Inc.

Trane Technologies plc vs Fastenal Company: Annual Revenue Growth Compared
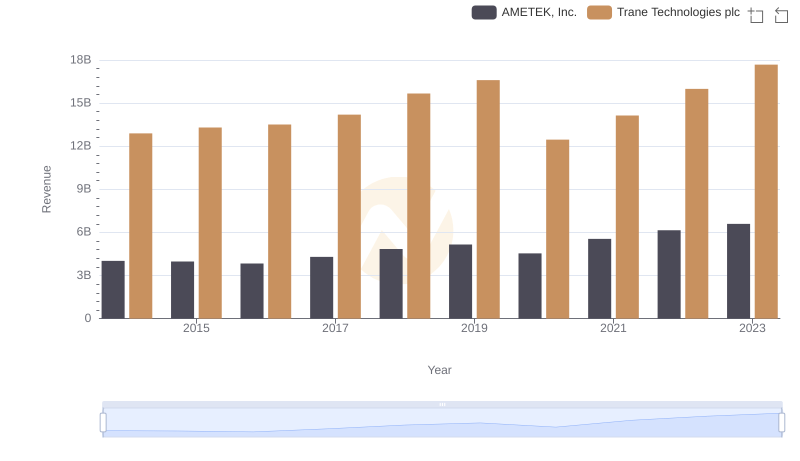
Trane Technologies plc vs AMETEK, Inc.: Annual Revenue Growth Compared
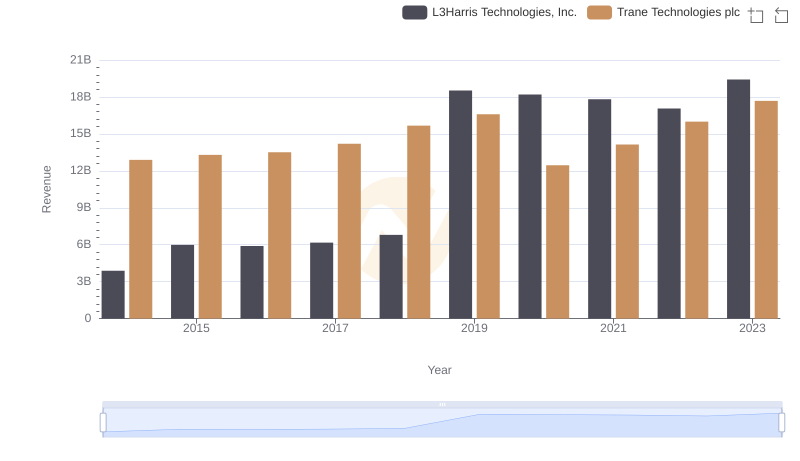
Trane Technologies plc vs L3Harris Technologies, Inc.: Examining Key Revenue Metrics
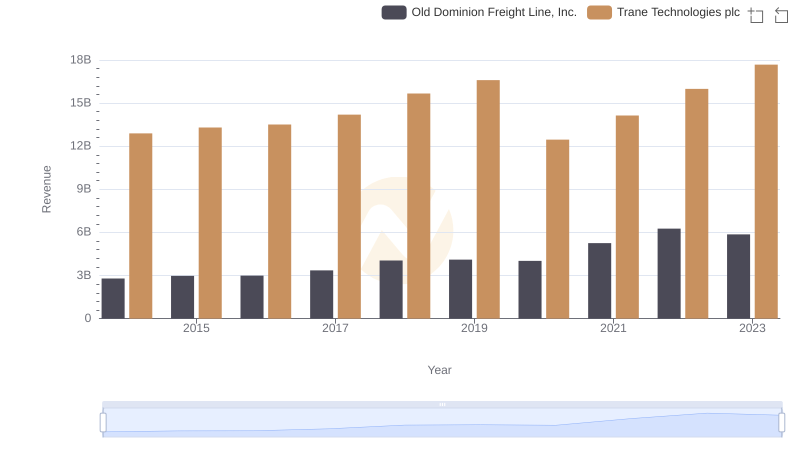
Annual Revenue Comparison: Trane Technologies plc vs Old Dominion Freight Line, Inc.
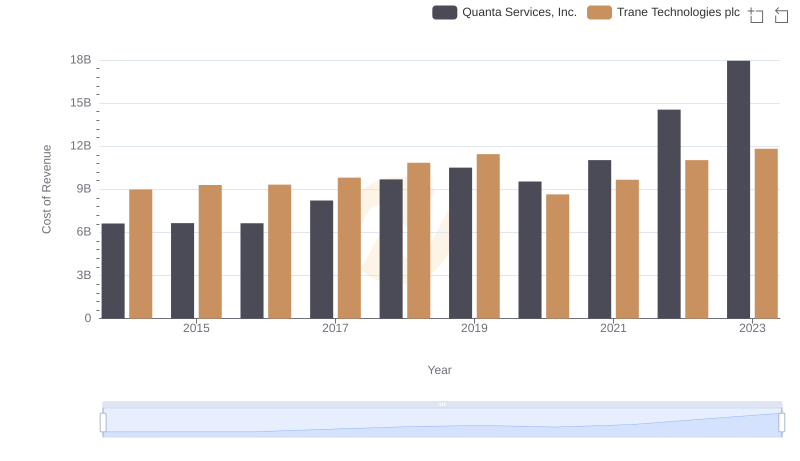
Comparing Cost of Revenue Efficiency: Trane Technologies plc vs Quanta Services, Inc.