| __timestamp | Fastenal Company | Trane Technologies plc |
|---|---|---|
| Wednesday, January 1, 2014 | 3733507000 | 12891400000 |
| Thursday, January 1, 2015 | 3869187000 | 13300700000 |
| Friday, January 1, 2016 | 3962036000 | 13508900000 |
| Sunday, January 1, 2017 | 4390500000 | 14197600000 |
| Monday, January 1, 2018 | 4965100000 | 15668200000 |
| Tuesday, January 1, 2019 | 5333700000 | 16598900000 |
| Wednesday, January 1, 2020 | 5647300000 | 12454700000 |
| Friday, January 1, 2021 | 6010900000 | 14136400000 |
| Saturday, January 1, 2022 | 6980600000 | 15991700000 |
| Sunday, January 1, 2023 | 7346700000 | 17677600000 |
| Monday, January 1, 2024 | 7546000000 | 19838200000 |
Unveiling the hidden dimensions of data
In the competitive landscape of industrial giants, Trane Technologies and Fastenal have showcased remarkable revenue trajectories over the past decade. From 2014 to 2023, Fastenal's revenue surged by nearly 102%, reflecting its robust expansion strategy. Meanwhile, Trane Technologies, despite a dip in 2020, rebounded with a 37% increase by 2023, underscoring its resilience and adaptability.
Fastenal's consistent growth, peaking at $7.35 billion in 2023, highlights its strategic market positioning and operational efficiency. This growth trajectory is a testament to its ability to capitalize on market opportunities and expand its footprint.
Trane Technologies, with a revenue peak of $17.68 billion in 2023, demonstrates its strong market presence. The dip in 2020, followed by a swift recovery, illustrates its capacity to navigate economic challenges and emerge stronger.
Both companies exemplify industrial prowess, with their revenue trends offering insights into strategic growth and market resilience.
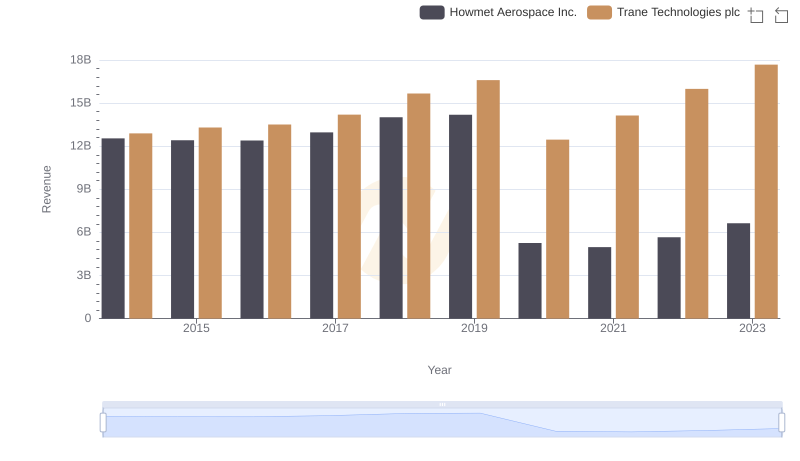
Breaking Down Revenue Trends: Trane Technologies plc vs Howmet Aerospace Inc.
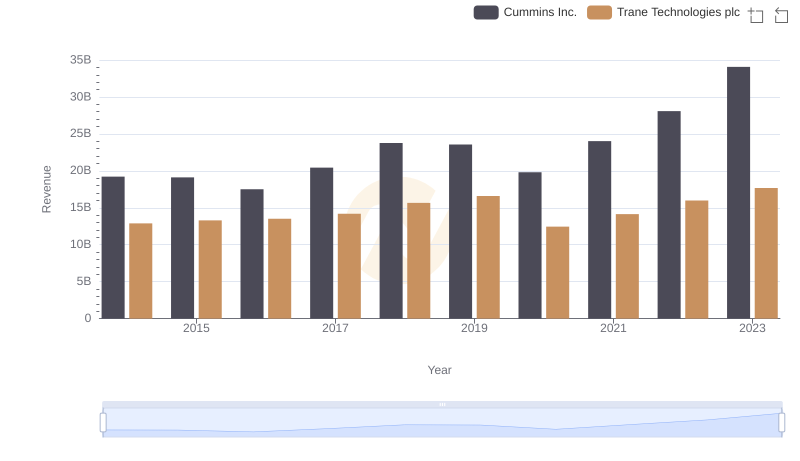
Revenue Showdown: Trane Technologies plc vs Cummins Inc.
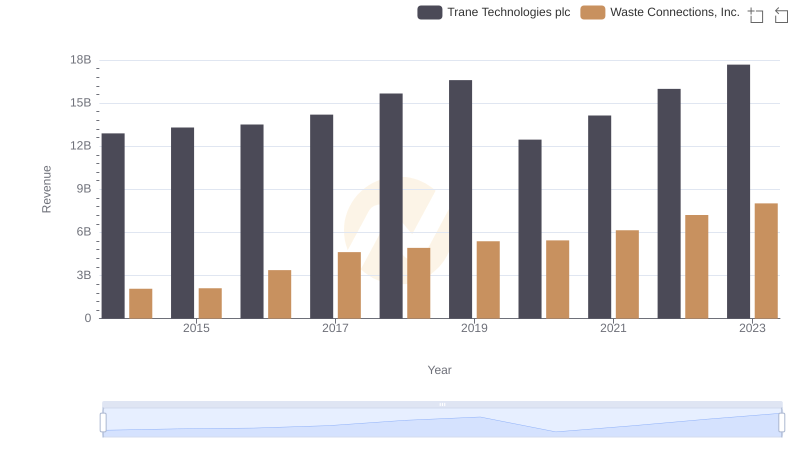
Trane Technologies plc vs Waste Connections, Inc.: Annual Revenue Growth Compared
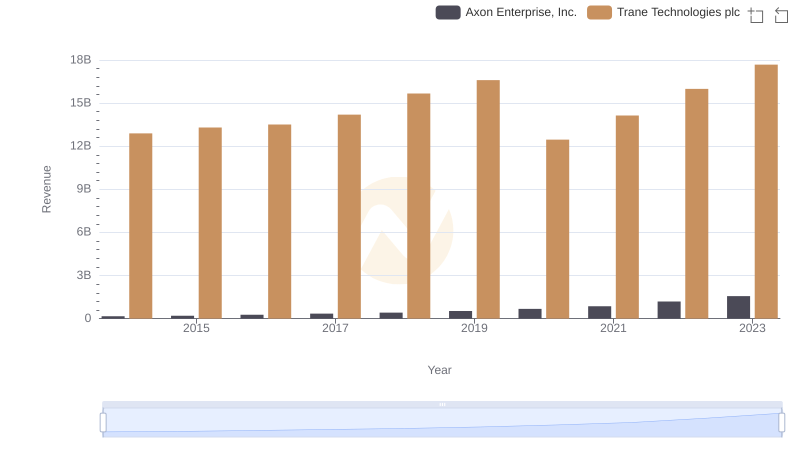
Revenue Showdown: Trane Technologies plc vs Axon Enterprise, Inc.
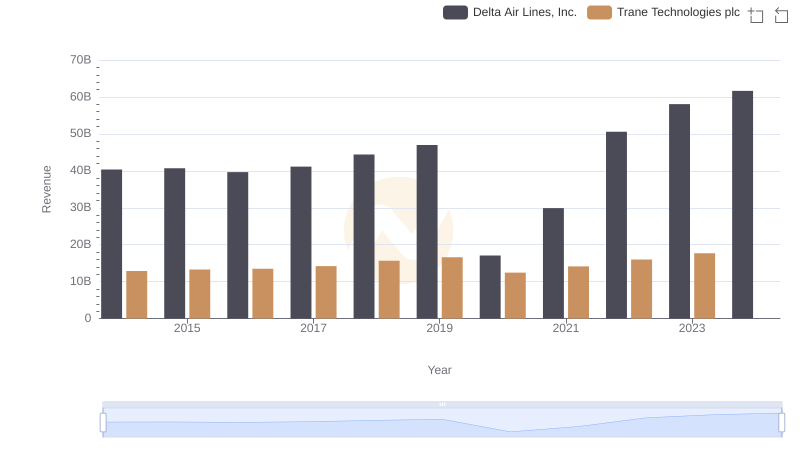
Who Generates More Revenue? Trane Technologies plc or Delta Air Lines, Inc.
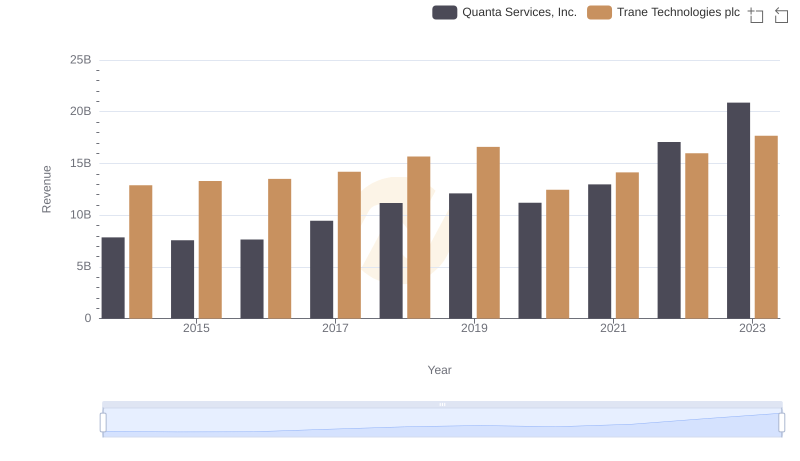
Annual Revenue Comparison: Trane Technologies plc vs Quanta Services, Inc.
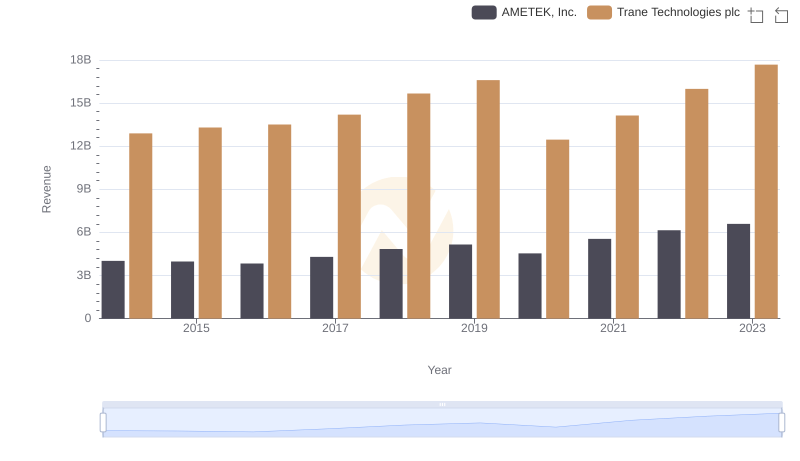
Trane Technologies plc vs AMETEK, Inc.: Annual Revenue Growth Compared
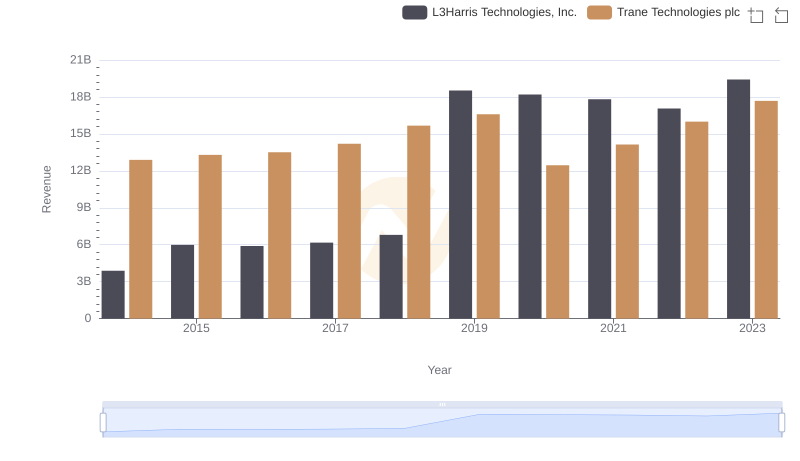
Trane Technologies plc vs L3Harris Technologies, Inc.: Examining Key Revenue Metrics
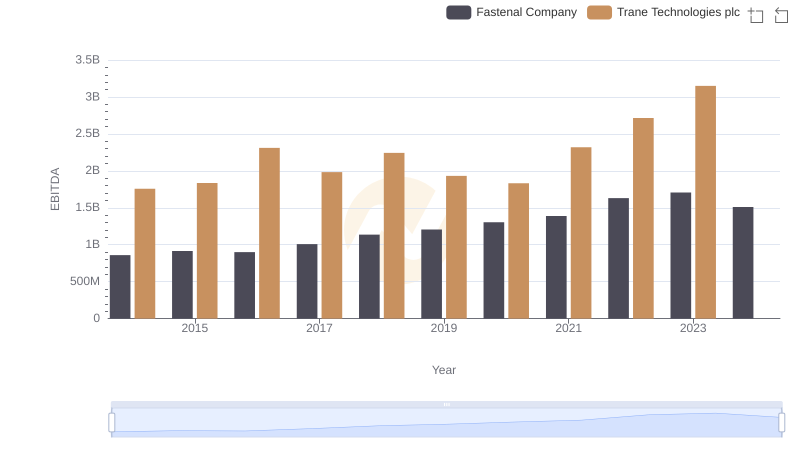
Trane Technologies plc and Fastenal Company: A Detailed Examination of EBITDA Performance