| __timestamp | AMETEK, Inc. | Trane Technologies plc |
|---|---|---|
| Wednesday, January 1, 2014 | 4021964000 | 12891400000 |
| Thursday, January 1, 2015 | 3974295000 | 13300700000 |
| Friday, January 1, 2016 | 3840087000 | 13508900000 |
| Sunday, January 1, 2017 | 4300170000 | 14197600000 |
| Monday, January 1, 2018 | 4845872000 | 15668200000 |
| Tuesday, January 1, 2019 | 5158557000 | 16598900000 |
| Wednesday, January 1, 2020 | 4540029000 | 12454700000 |
| Friday, January 1, 2021 | 5546514000 | 14136400000 |
| Saturday, January 1, 2022 | 6150530000 | 15991700000 |
| Sunday, January 1, 2023 | 6596950000 | 17677600000 |
| Monday, January 1, 2024 | 6941180000 | 19838200000 |
Data in motion
In the ever-evolving landscape of industrial technology, Trane Technologies plc and AMETEK, Inc. have emerged as formidable players. Over the past decade, these companies have demonstrated remarkable resilience and growth. From 2014 to 2023, Trane Technologies saw its revenue soar by approximately 37%, while AMETEK experienced an impressive 64% increase.
Trane Technologies, with its focus on climate innovation, consistently outpaced AMETEK in absolute revenue, peaking at $17.68 billion in 2023. Meanwhile, AMETEK, a leader in electronic instruments, reached $6.60 billion in the same year. Despite a dip in 2020, both companies rebounded strongly, showcasing their adaptability in a challenging economic environment.
As we look to the future, the strategic initiatives and technological advancements of these industry titans will undoubtedly shape the next chapter of industrial growth.
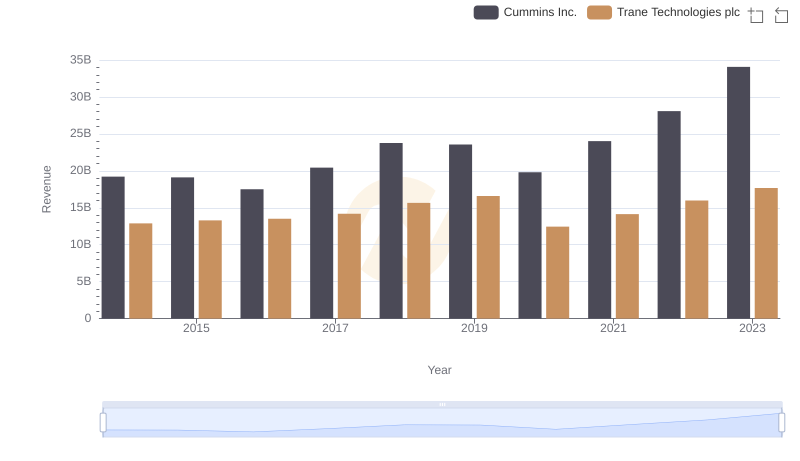
Revenue Showdown: Trane Technologies plc vs Cummins Inc.
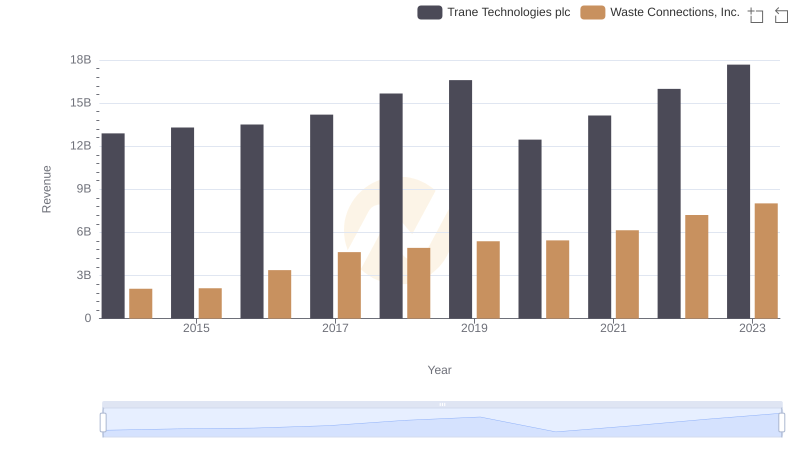
Trane Technologies plc vs Waste Connections, Inc.: Annual Revenue Growth Compared
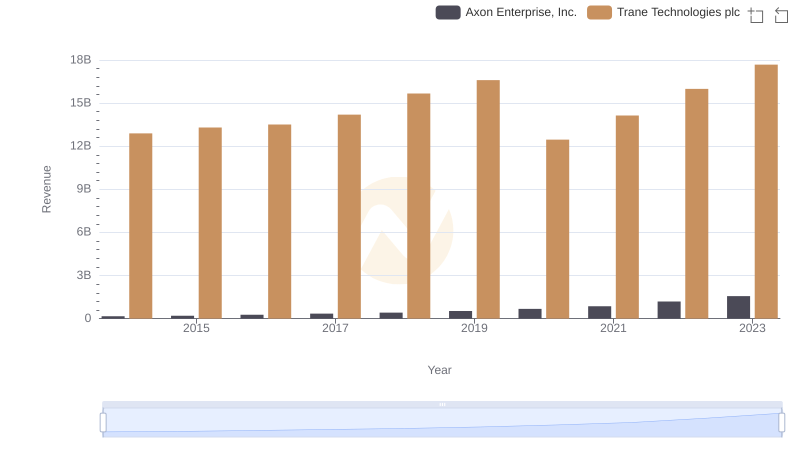
Revenue Showdown: Trane Technologies plc vs Axon Enterprise, Inc.
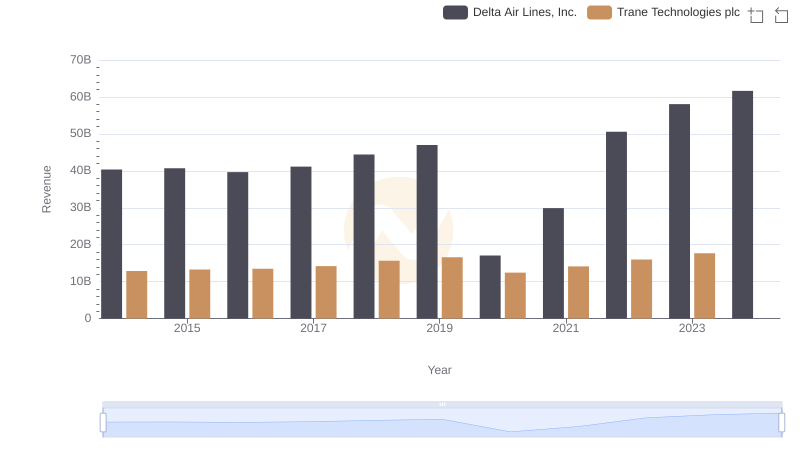
Who Generates More Revenue? Trane Technologies plc or Delta Air Lines, Inc.

Trane Technologies plc vs Fastenal Company: Annual Revenue Growth Compared
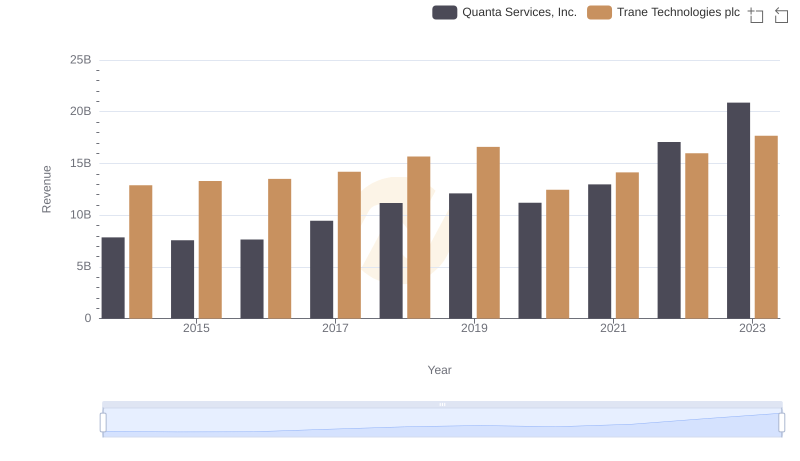
Annual Revenue Comparison: Trane Technologies plc vs Quanta Services, Inc.
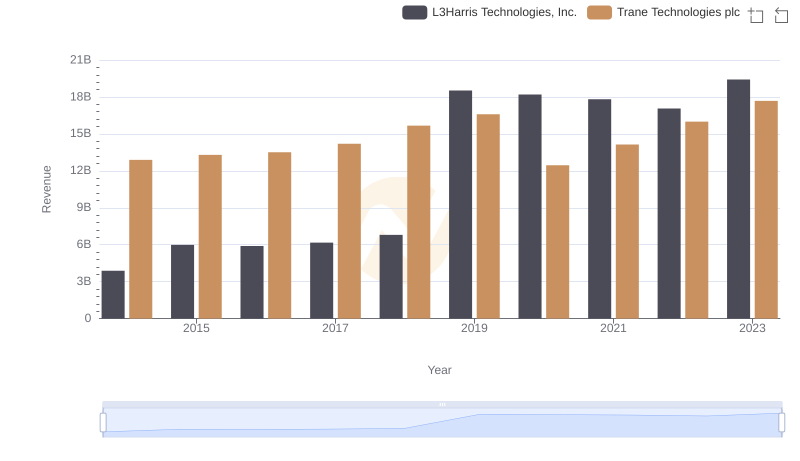
Trane Technologies plc vs L3Harris Technologies, Inc.: Examining Key Revenue Metrics
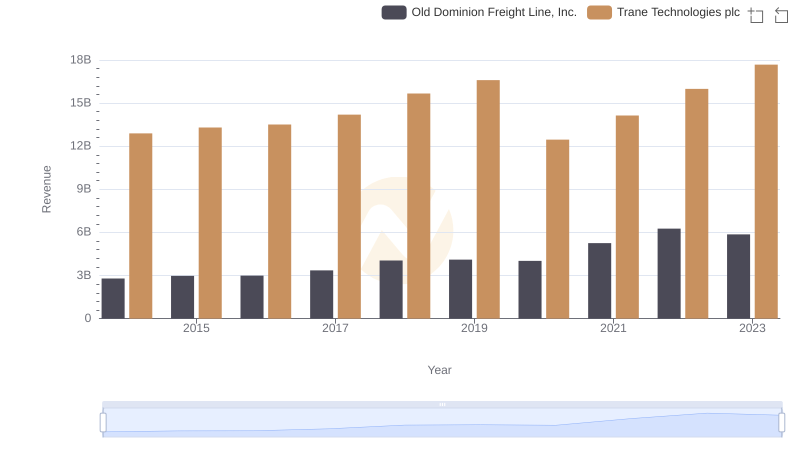
Annual Revenue Comparison: Trane Technologies plc vs Old Dominion Freight Line, Inc.
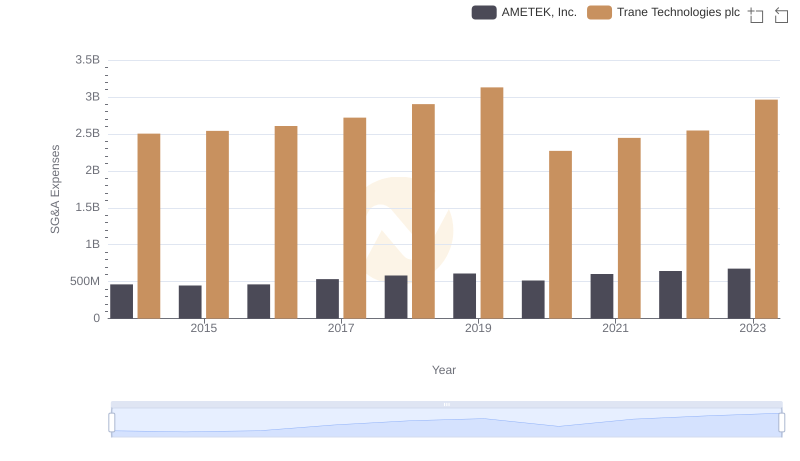
Trane Technologies plc vs AMETEK, Inc.: SG&A Expense Trends
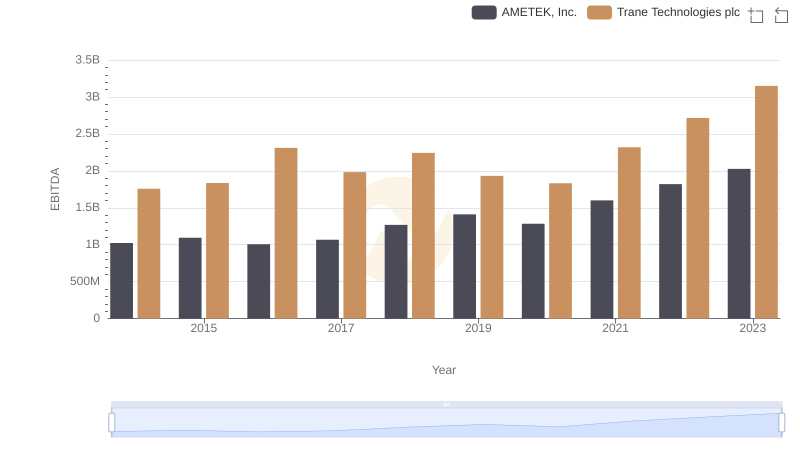
EBITDA Performance Review: Trane Technologies plc vs AMETEK, Inc.