| __timestamp | IDEX Corporation | Trane Technologies plc |
|---|---|---|
| Wednesday, January 1, 2014 | 504419000 | 2503900000 |
| Thursday, January 1, 2015 | 479408000 | 2541100000 |
| Friday, January 1, 2016 | 498994000 | 2606500000 |
| Sunday, January 1, 2017 | 524940000 | 2720700000 |
| Monday, January 1, 2018 | 536724000 | 2903200000 |
| Tuesday, January 1, 2019 | 524987000 | 3129800000 |
| Wednesday, January 1, 2020 | 494935000 | 2270600000 |
| Friday, January 1, 2021 | 578200000 | 2446300000 |
| Saturday, January 1, 2022 | 652700000 | 2545900000 |
| Sunday, January 1, 2023 | 703500000 | 2963200000 |
| Monday, January 1, 2024 | 758700000 | 3580400000 |
In pursuit of knowledge
In the ever-evolving landscape of industrial technology, understanding financial trends is crucial. Over the past decade, Trane Technologies plc and IDEX Corporation have showcased distinct trajectories in their Selling, General, and Administrative (SG&A) expenses. From 2014 to 2023, Trane Technologies consistently reported higher SG&A expenses, peaking in 2019 with a 25% increase from 2014. Meanwhile, IDEX Corporation's expenses grew more modestly, with a notable 40% rise by 2023. This divergence highlights Trane's aggressive expansion and investment strategies compared to IDEX's more conservative approach. The data reveals a dip in 2020 for Trane, likely reflecting pandemic-related adjustments, while IDEX maintained steady growth. These insights offer a window into each company's operational priorities and market strategies, providing valuable context for investors and industry analysts alike.
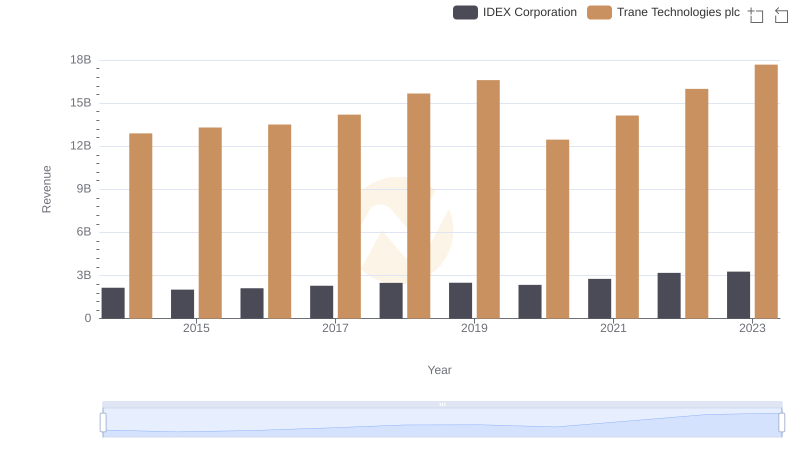
Who Generates More Revenue? Trane Technologies plc or IDEX Corporation

Comparing Cost of Revenue Efficiency: Trane Technologies plc vs IDEX Corporation
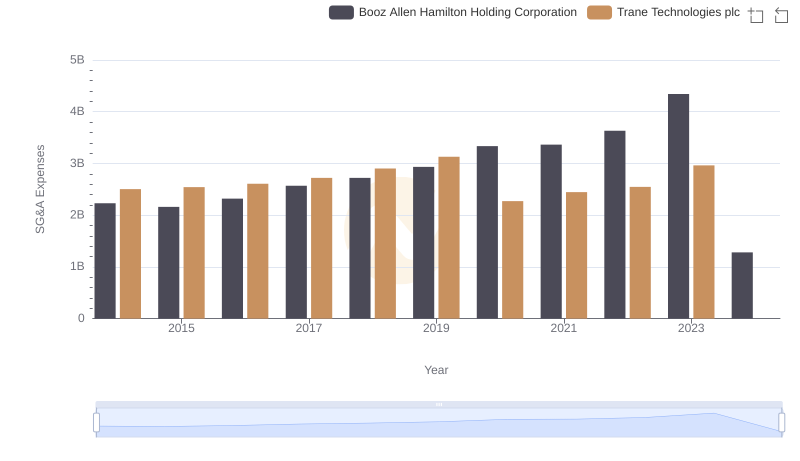
Trane Technologies plc and Booz Allen Hamilton Holding Corporation: SG&A Spending Patterns Compared
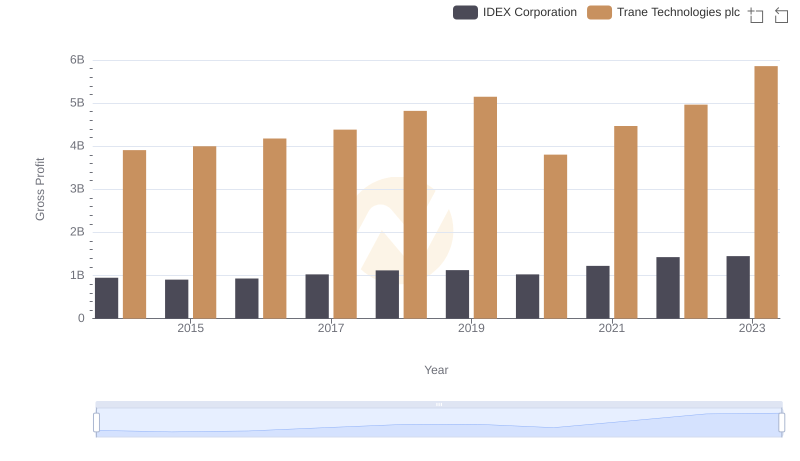
Trane Technologies plc vs IDEX Corporation: A Gross Profit Performance Breakdown
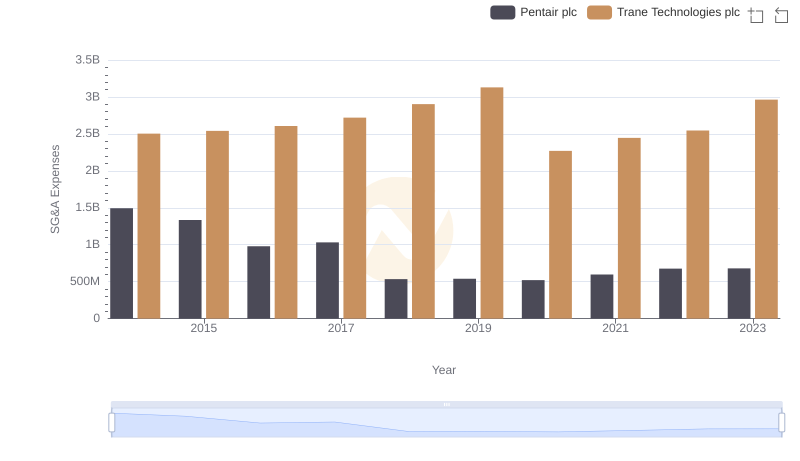
SG&A Efficiency Analysis: Comparing Trane Technologies plc and Pentair plc
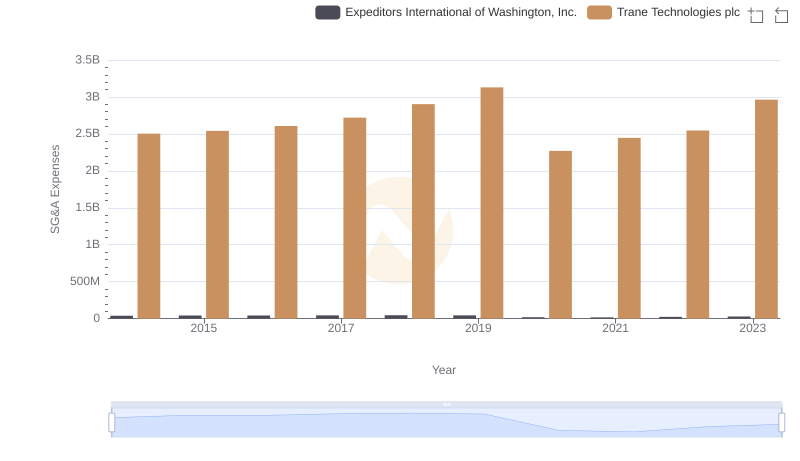
Breaking Down SG&A Expenses: Trane Technologies plc vs Expeditors International of Washington, Inc.
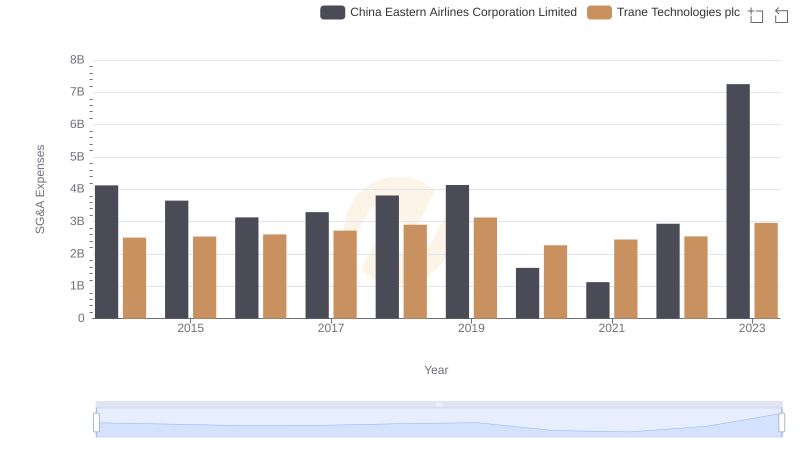
Comparing SG&A Expenses: Trane Technologies plc vs China Eastern Airlines Corporation Limited Trends and Insights
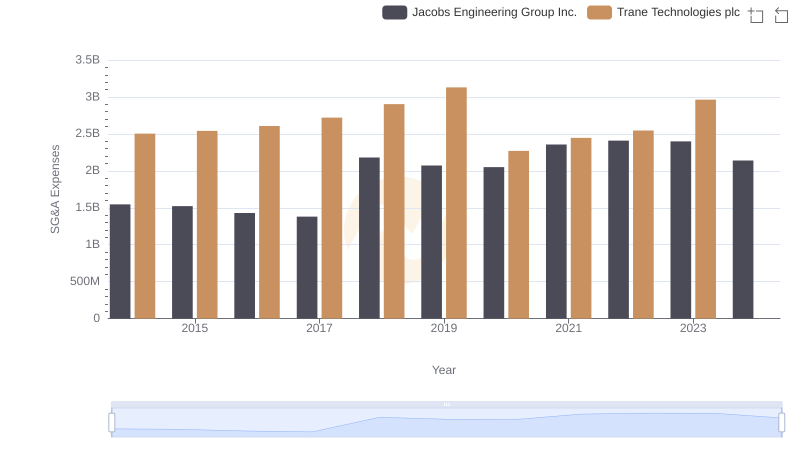
Breaking Down SG&A Expenses: Trane Technologies plc vs Jacobs Engineering Group Inc.
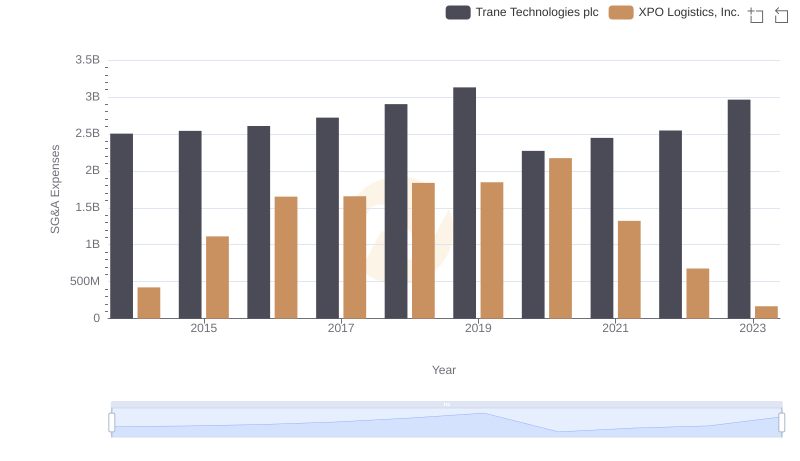
Cost Management Insights: SG&A Expenses for Trane Technologies plc and XPO Logistics, Inc.
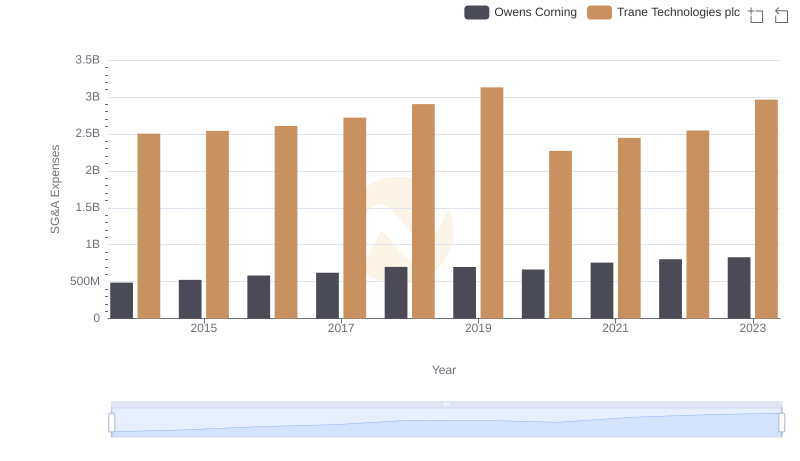
Trane Technologies plc or Owens Corning: Who Manages SG&A Costs Better?
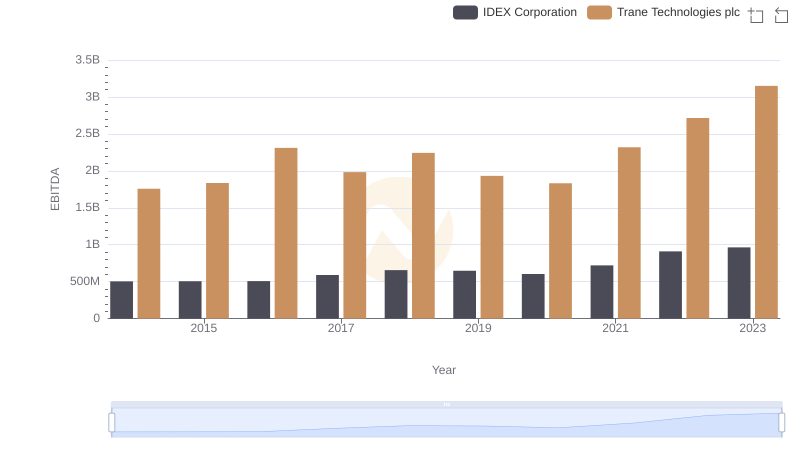
Professional EBITDA Benchmarking: Trane Technologies plc vs IDEX Corporation