| __timestamp | Expeditors International of Washington, Inc. | Trane Technologies plc |
|---|---|---|
| Wednesday, January 1, 2014 | 643940000 | 1757000000 |
| Thursday, January 1, 2015 | 767496000 | 1835000000 |
| Friday, January 1, 2016 | 716959000 | 2311000000 |
| Sunday, January 1, 2017 | 749570000 | 1982500000 |
| Monday, January 1, 2018 | 850582000 | 2242400000 |
| Tuesday, January 1, 2019 | 817642000 | 1931200000 |
| Wednesday, January 1, 2020 | 1013523000 | 1831900000 |
| Friday, January 1, 2021 | 1975928000 | 2319200000 |
| Saturday, January 1, 2022 | 1916506000 | 2715500000 |
| Sunday, January 1, 2023 | 1087588000 | 3149900000 |
| Monday, January 1, 2024 | 1154330000 | 3859600000 |
Cracking the code
In the ever-evolving landscape of global business, understanding the financial health of industry giants is crucial. Over the past decade, Trane Technologies plc and Expeditors International of Washington, Inc. have showcased distinct EBITDA trajectories. From 2014 to 2023, Trane Technologies consistently outperformed, with a remarkable 79% increase in EBITDA, peaking at approximately $3.15 billion in 2023. In contrast, Expeditors International experienced a more volatile journey, with a 69% rise, reaching its zenith in 2021.
This comparative analysis highlights the dynamic nature of these sectors, offering valuable insights for investors and industry analysts alike.
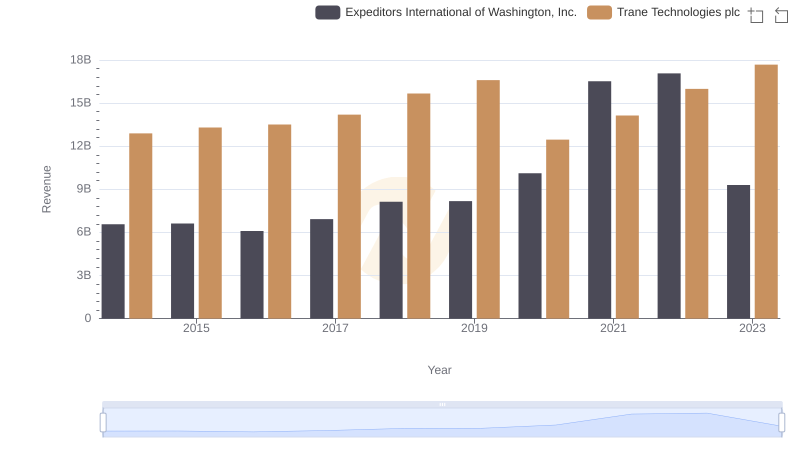
Annual Revenue Comparison: Trane Technologies plc vs Expeditors International of Washington, Inc.
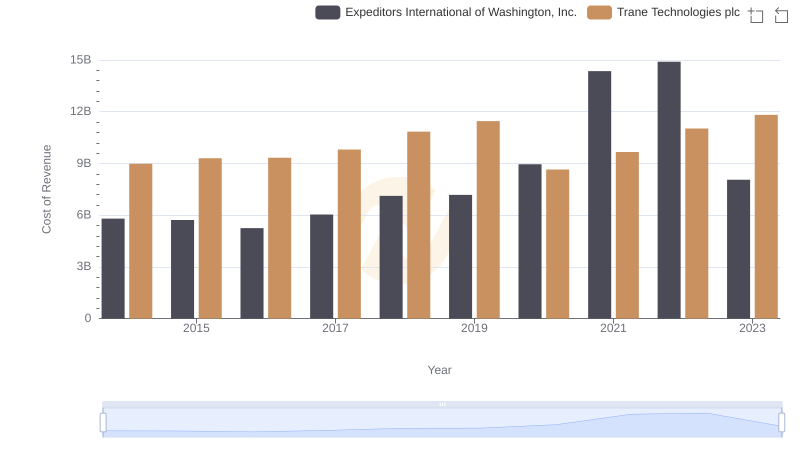
Analyzing Cost of Revenue: Trane Technologies plc and Expeditors International of Washington, Inc.
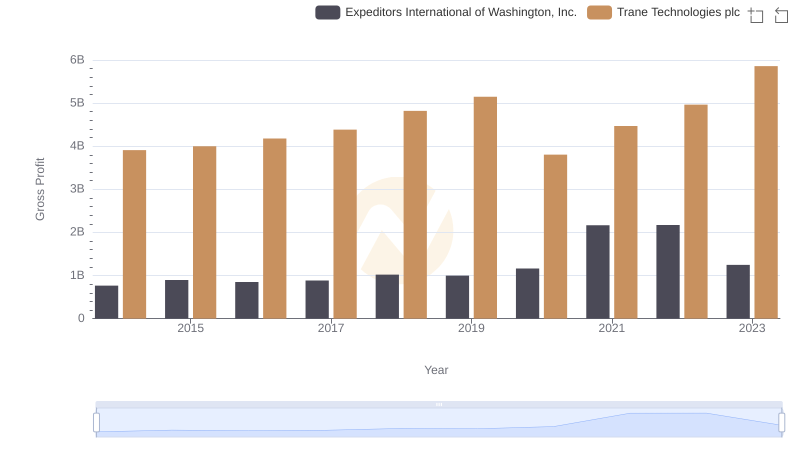
Trane Technologies plc vs Expeditors International of Washington, Inc.: A Gross Profit Performance Breakdown
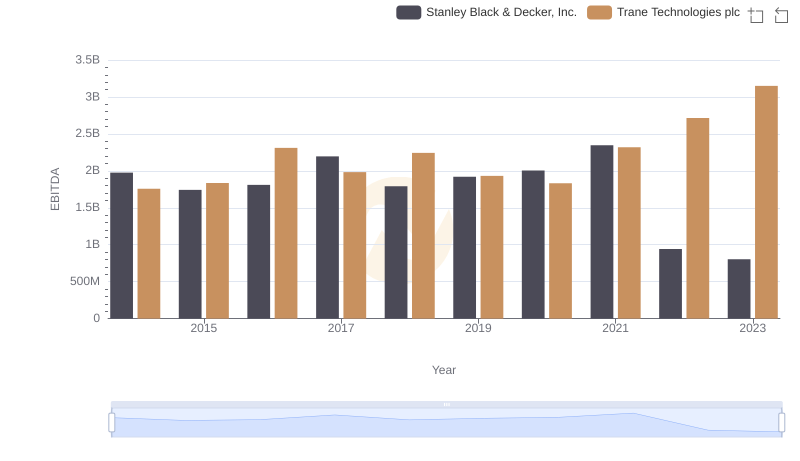
EBITDA Metrics Evaluated: Trane Technologies plc vs Stanley Black & Decker, Inc.
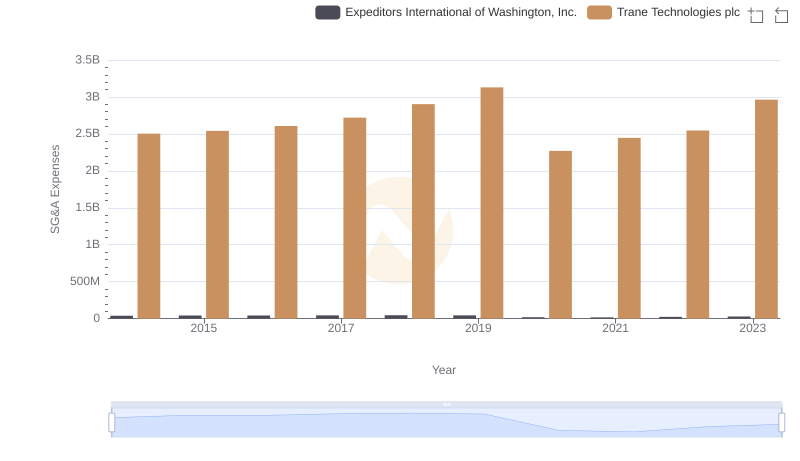
Breaking Down SG&A Expenses: Trane Technologies plc vs Expeditors International of Washington, Inc.

Professional EBITDA Benchmarking: Trane Technologies plc vs Booz Allen Hamilton Holding Corporation
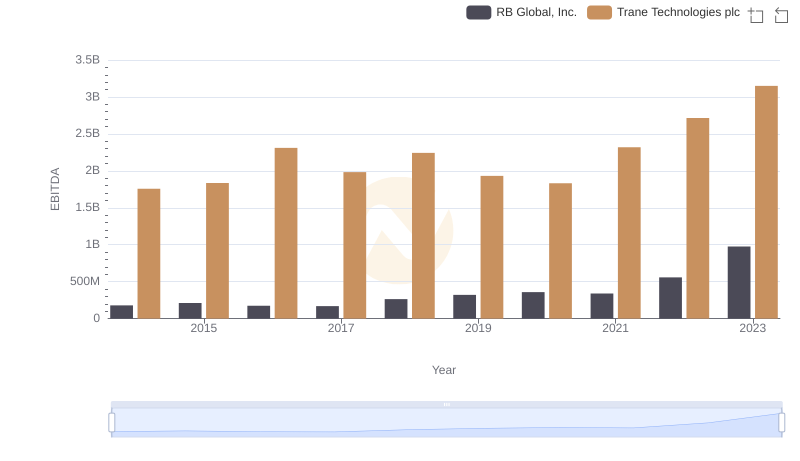
Comprehensive EBITDA Comparison: Trane Technologies plc vs RB Global, Inc.
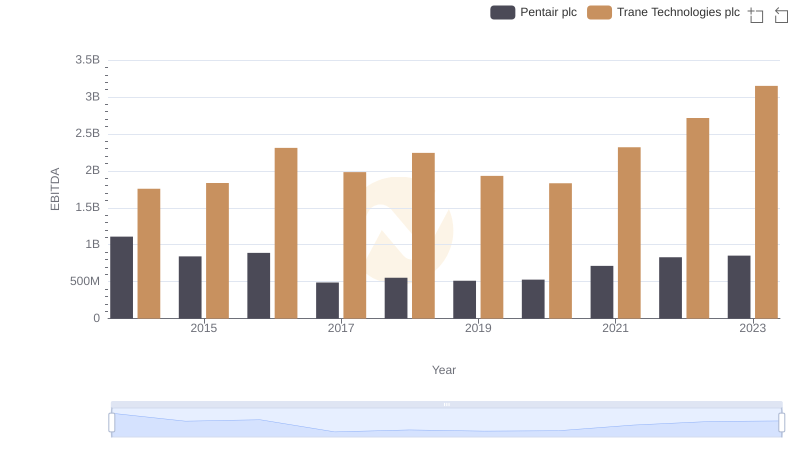
EBITDA Performance Review: Trane Technologies plc vs Pentair plc
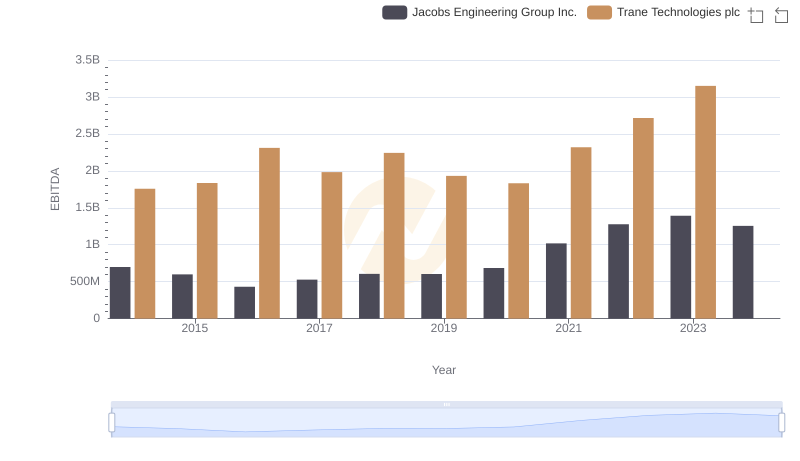
EBITDA Analysis: Evaluating Trane Technologies plc Against Jacobs Engineering Group Inc.
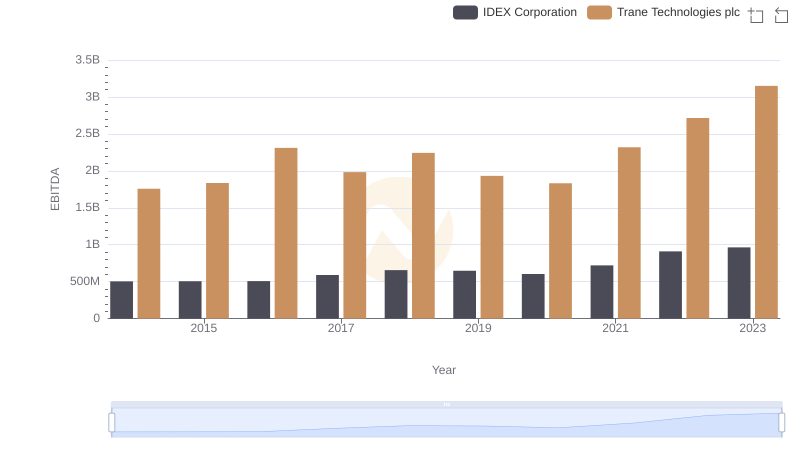
Professional EBITDA Benchmarking: Trane Technologies plc vs IDEX Corporation
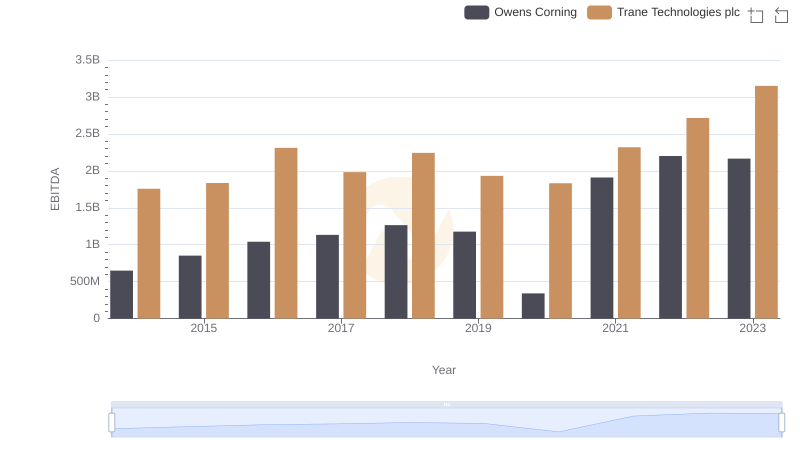
A Professional Review of EBITDA: Trane Technologies plc Compared to Owens Corning
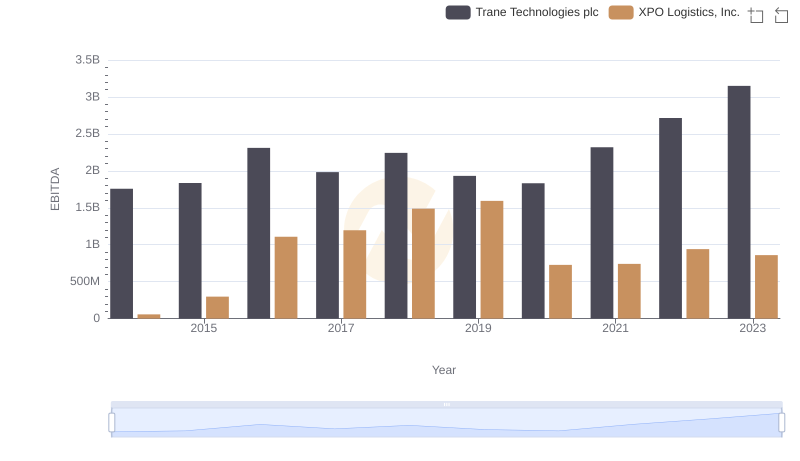
A Professional Review of EBITDA: Trane Technologies plc Compared to XPO Logistics, Inc.