| __timestamp | Trane Technologies plc | XPO Logistics, Inc. |
|---|---|---|
| Wednesday, January 1, 2014 | 1757000000 | 56600000 |
| Thursday, January 1, 2015 | 1835000000 | 298000000 |
| Friday, January 1, 2016 | 2311000000 | 1108300000 |
| Sunday, January 1, 2017 | 1982500000 | 1196700000 |
| Monday, January 1, 2018 | 2242400000 | 1488000000 |
| Tuesday, January 1, 2019 | 1931200000 | 1594000000 |
| Wednesday, January 1, 2020 | 1831900000 | 727000000 |
| Friday, January 1, 2021 | 2319200000 | 741000000 |
| Saturday, January 1, 2022 | 2715500000 | 941000000 |
| Sunday, January 1, 2023 | 3149900000 | 860000000 |
| Monday, January 1, 2024 | 3859600000 | 1186000000 |
Infusing magic into the data realm
In the ever-evolving landscape of industrial and logistics sectors, Trane Technologies plc and XPO Logistics, Inc. have showcased intriguing financial trajectories over the past decade. From 2014 to 2023, Trane Technologies consistently outperformed XPO Logistics in terms of EBITDA, reflecting a robust growth strategy and operational efficiency.
Trane Technologies saw its EBITDA grow by approximately 79% from 2014 to 2023, peaking at $3.15 billion in 2023. This growth underscores its resilience and adaptability in a competitive market. In contrast, XPO Logistics experienced a more volatile journey, with its EBITDA fluctuating significantly, reaching a high of $1.59 billion in 2019 before settling at $860 million in 2023.
This comparison highlights the strategic differences between the two companies, offering valuable insights for investors and industry analysts alike.
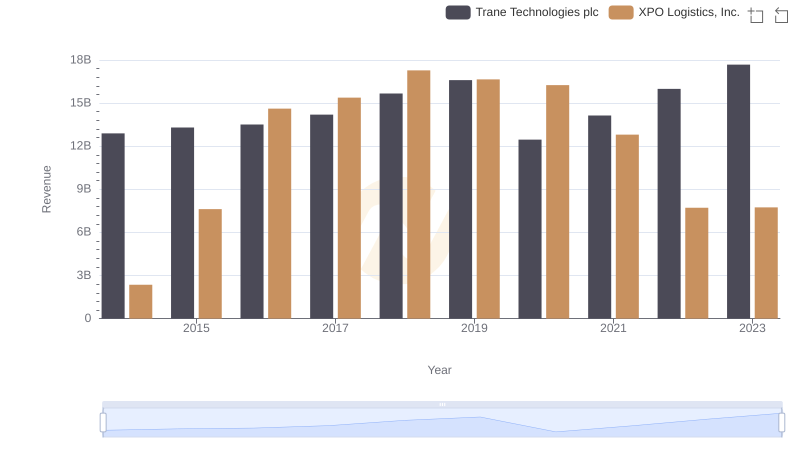
Trane Technologies plc or XPO Logistics, Inc.: Who Leads in Yearly Revenue?
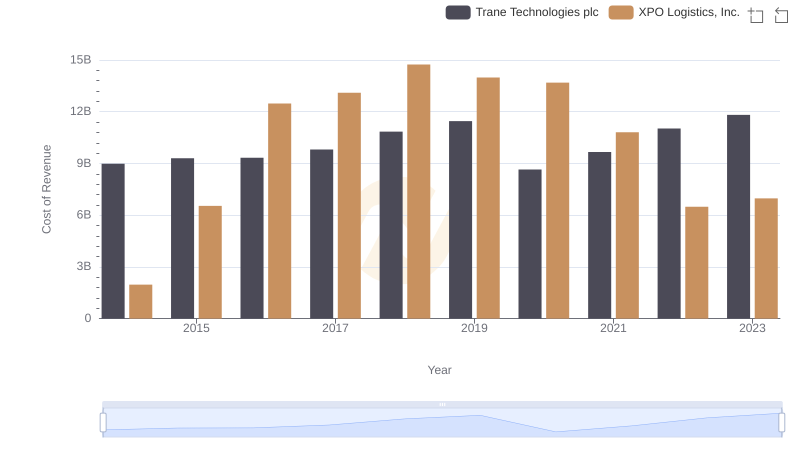
Cost of Revenue Trends: Trane Technologies plc vs XPO Logistics, Inc.
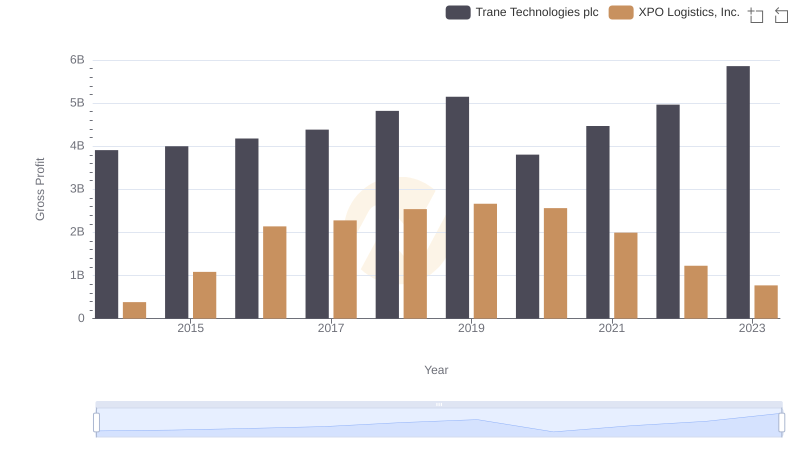
Key Insights on Gross Profit: Trane Technologies plc vs XPO Logistics, Inc.
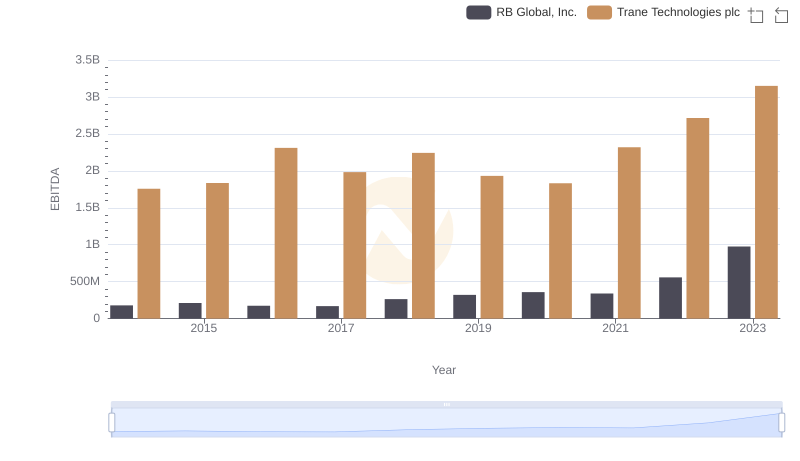
Comprehensive EBITDA Comparison: Trane Technologies plc vs RB Global, Inc.
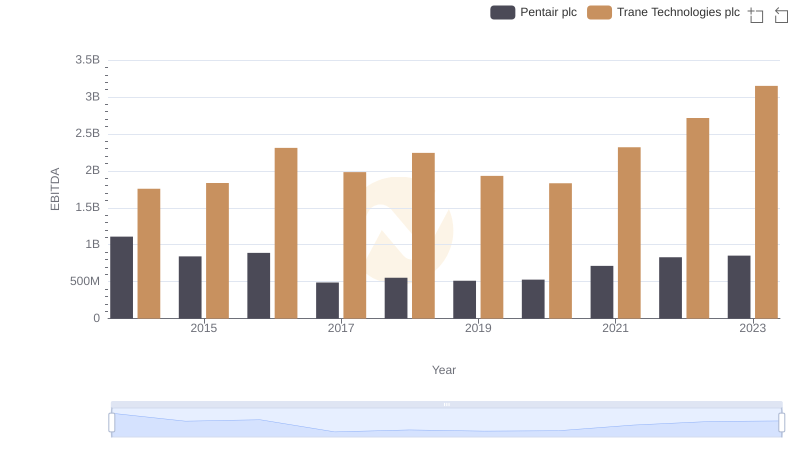
EBITDA Performance Review: Trane Technologies plc vs Pentair plc
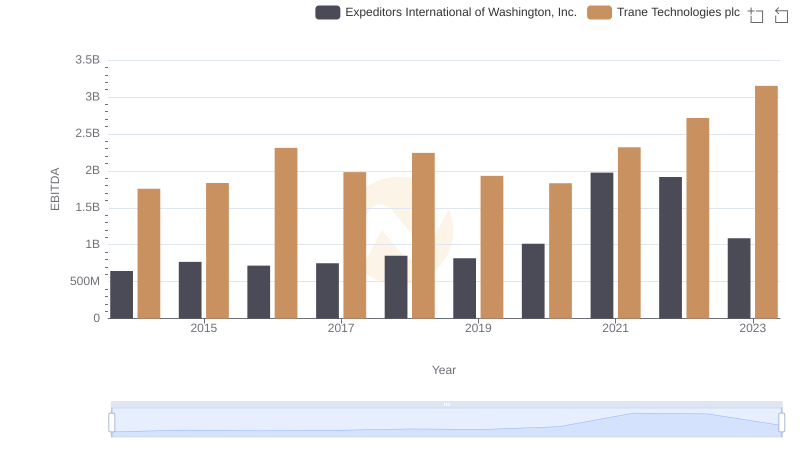
Trane Technologies plc vs Expeditors International of Washington, Inc.: In-Depth EBITDA Performance Comparison
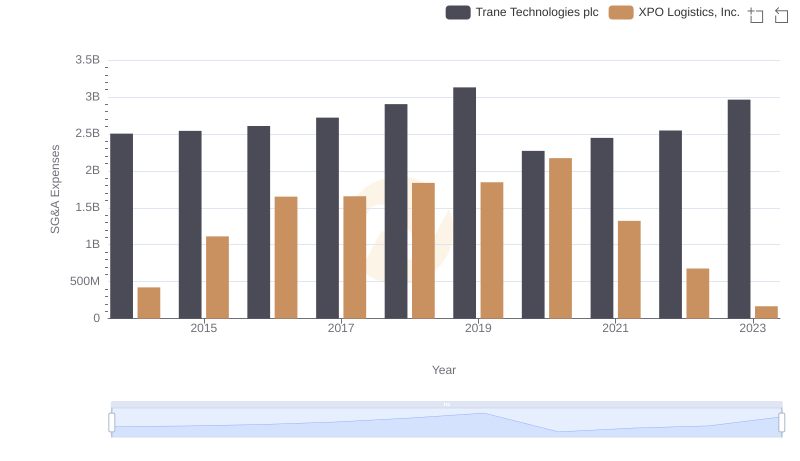
Cost Management Insights: SG&A Expenses for Trane Technologies plc and XPO Logistics, Inc.
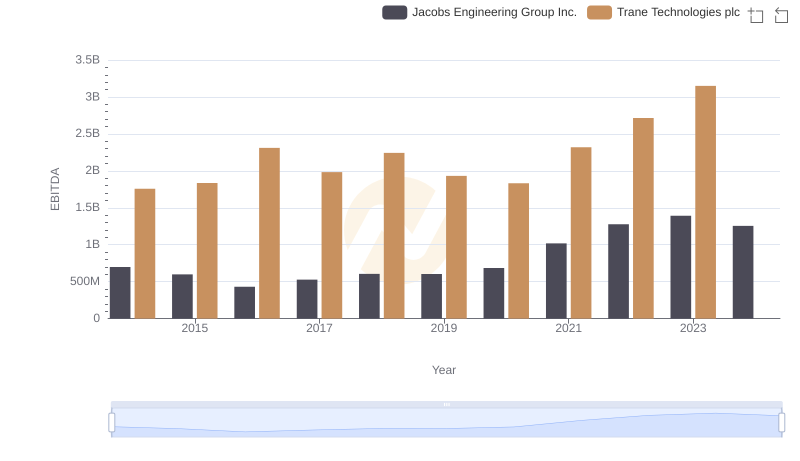
EBITDA Analysis: Evaluating Trane Technologies plc Against Jacobs Engineering Group Inc.
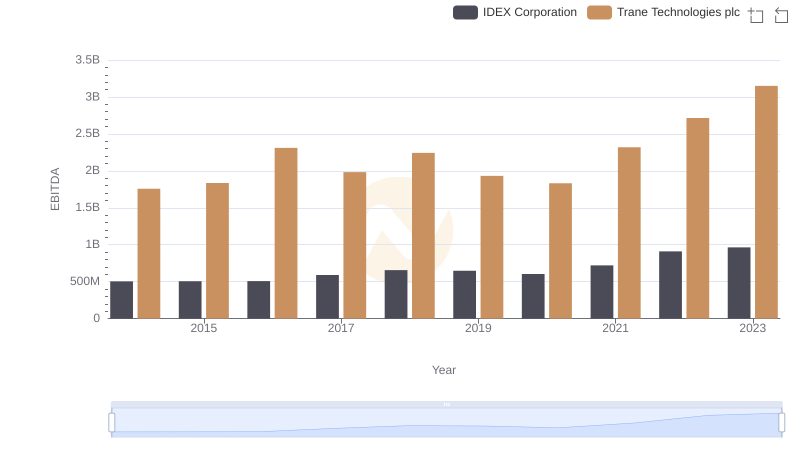
Professional EBITDA Benchmarking: Trane Technologies plc vs IDEX Corporation
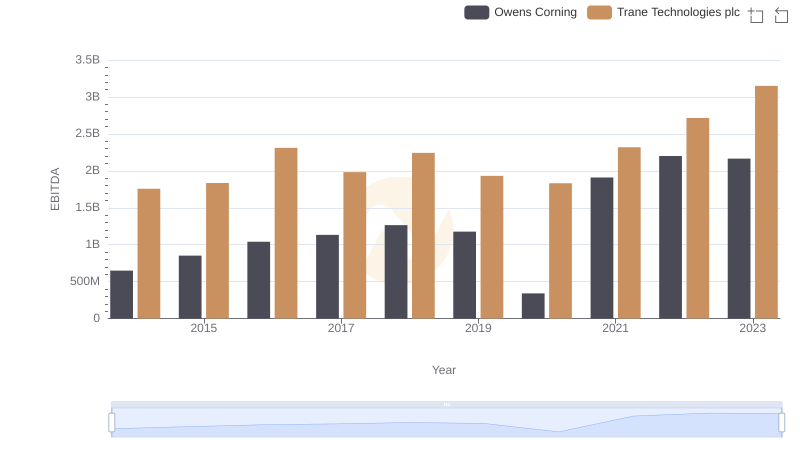
A Professional Review of EBITDA: Trane Technologies plc Compared to Owens Corning
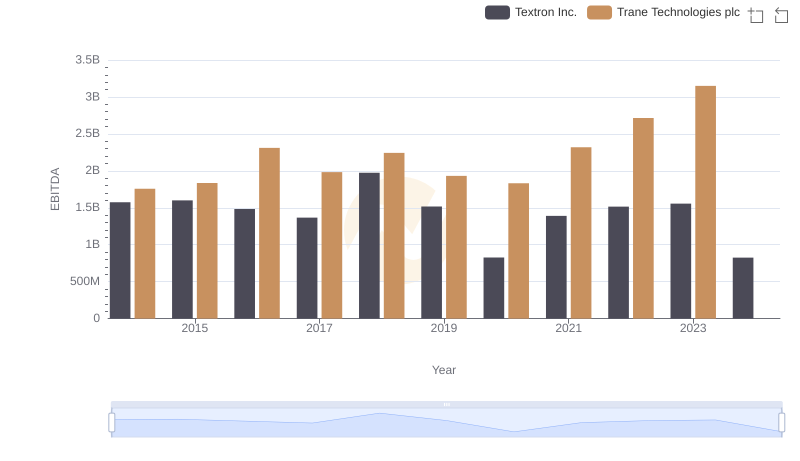
A Professional Review of EBITDA: Trane Technologies plc Compared to Textron Inc.
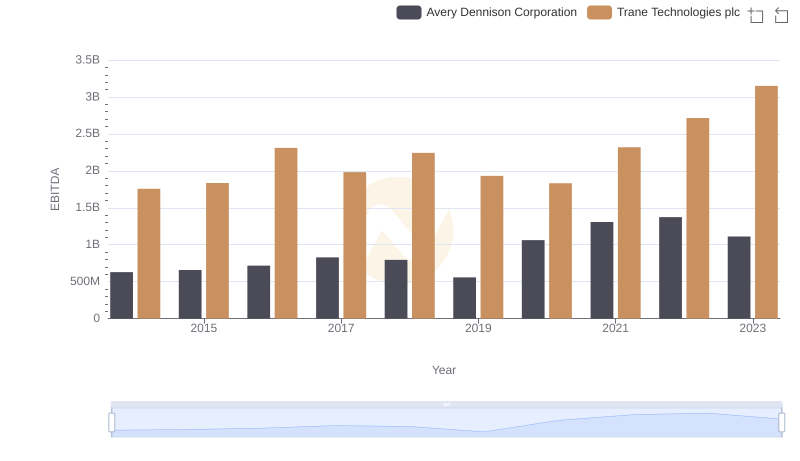
EBITDA Analysis: Evaluating Trane Technologies plc Against Avery Dennison Corporation