| __timestamp | Delta Air Lines, Inc. | Trane Technologies plc |
|---|---|---|
| Wednesday, January 1, 2014 | 32858000000 | 8982800000 |
| Thursday, January 1, 2015 | 27707000000 | 9301600000 |
| Friday, January 1, 2016 | 27876000000 | 9329300000 |
| Sunday, January 1, 2017 | 30671000000 | 9811600000 |
| Monday, January 1, 2018 | 34209000000 | 10847600000 |
| Tuesday, January 1, 2019 | 34982000000 | 11451500000 |
| Wednesday, January 1, 2020 | 23546000000 | 8651300000 |
| Friday, January 1, 2021 | 30078000000 | 9666800000 |
| Saturday, January 1, 2022 | 42767000000 | 11026900000 |
| Sunday, January 1, 2023 | 43913000000 | 11820400000 |
| Monday, January 1, 2024 | 46801000000 | 12757700000 |
Unlocking the unknown
In the ever-evolving landscape of global business, understanding the cost of revenue is crucial for evaluating a company's financial health. This analysis delves into the cost of revenue trends for Trane Technologies plc and Delta Air Lines, Inc. from 2014 to 2023.
Delta Air Lines, a titan in the aviation industry, saw its cost of revenue soar by approximately 42% over the decade, peaking in 2024. This reflects the airline's strategic expansions and operational challenges. In contrast, Trane Technologies, a leader in climate solutions, experienced a more modest increase of around 32% until 2023, highlighting its steady growth and efficient cost management.
Interestingly, 2020 marked a significant dip for both companies, likely due to the global pandemic's impact. As we look to the future, these trends offer valuable insights into the resilience and adaptability of these industry giants.
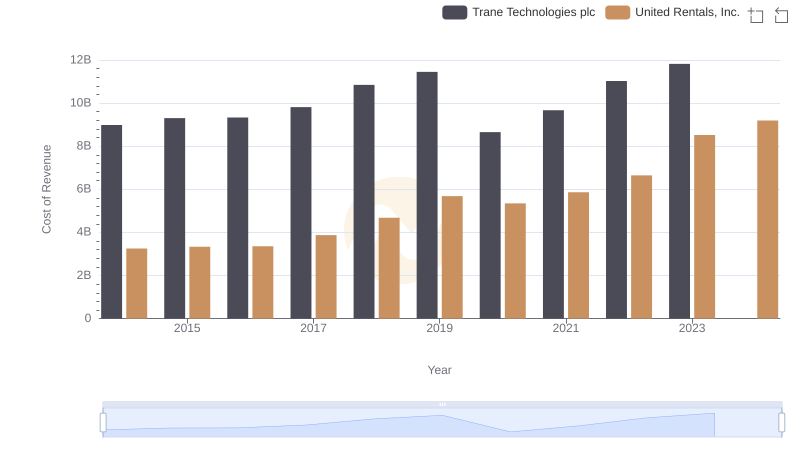
Cost of Revenue Trends: Trane Technologies plc vs United Rentals, Inc.
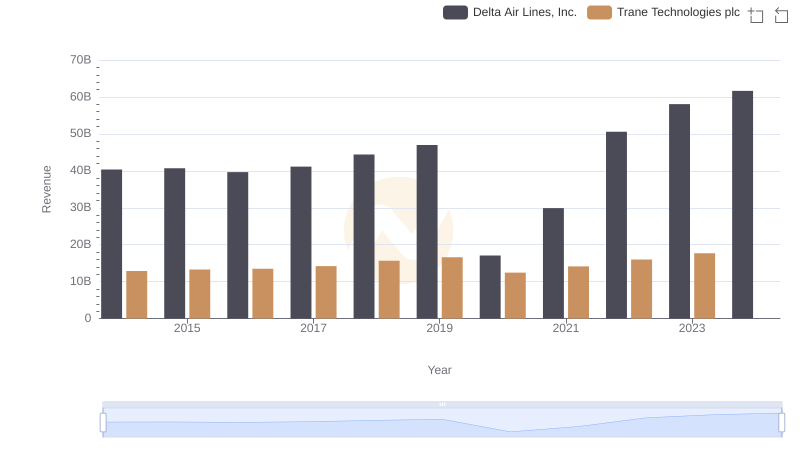
Who Generates More Revenue? Trane Technologies plc or Delta Air Lines, Inc.
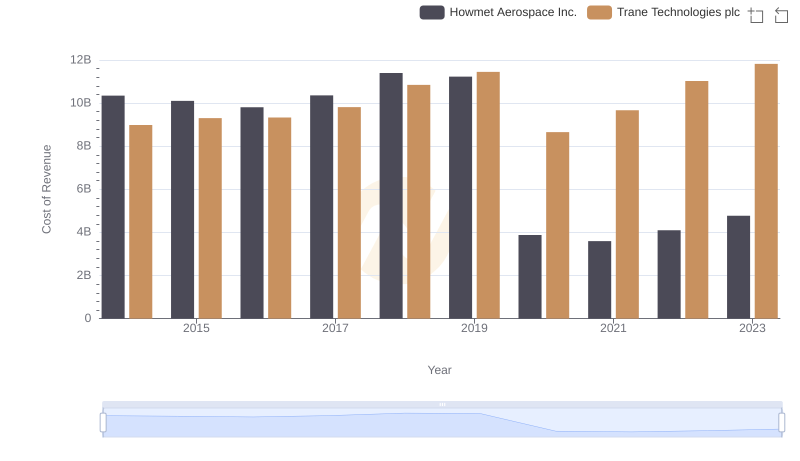
Cost of Revenue Trends: Trane Technologies plc vs Howmet Aerospace Inc.
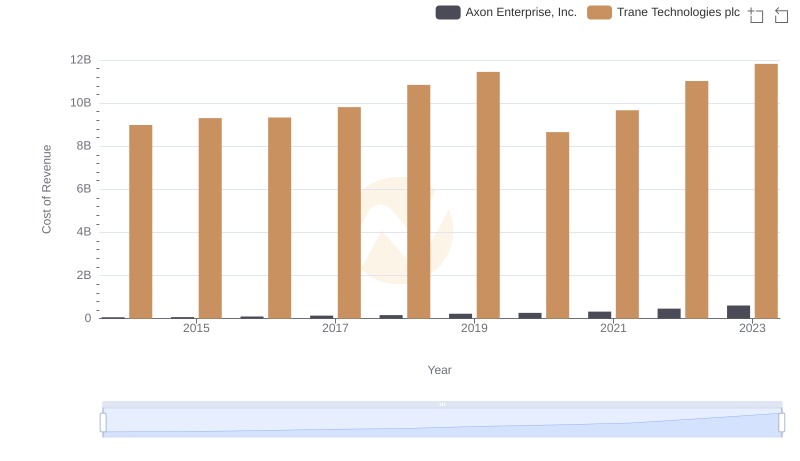
Cost of Revenue: Key Insights for Trane Technologies plc and Axon Enterprise, Inc.
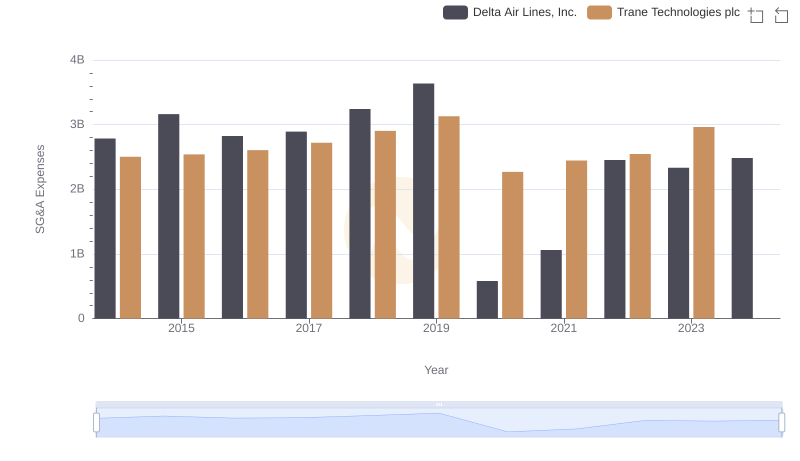
SG&A Efficiency Analysis: Comparing Trane Technologies plc and Delta Air Lines, Inc.
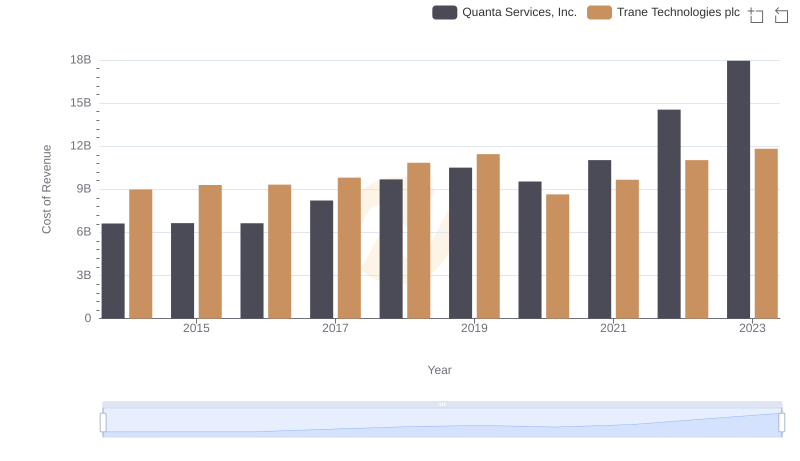
Comparing Cost of Revenue Efficiency: Trane Technologies plc vs Quanta Services, Inc.
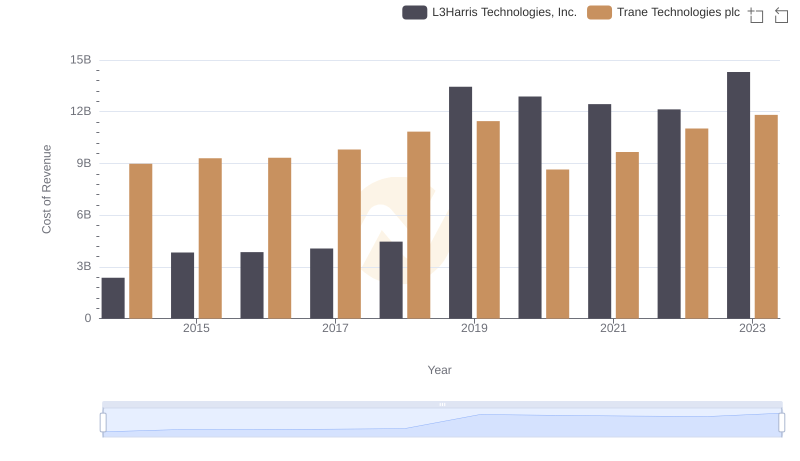
Trane Technologies plc vs L3Harris Technologies, Inc.: Efficiency in Cost of Revenue Explored