| __timestamp | AMETEK, Inc. | Trane Technologies plc |
|---|---|---|
| Wednesday, January 1, 2014 | 462637000 | 2503900000 |
| Thursday, January 1, 2015 | 448592000 | 2541100000 |
| Friday, January 1, 2016 | 462970000 | 2606500000 |
| Sunday, January 1, 2017 | 533645000 | 2720700000 |
| Monday, January 1, 2018 | 584022000 | 2903200000 |
| Tuesday, January 1, 2019 | 610280000 | 3129800000 |
| Wednesday, January 1, 2020 | 515630000 | 2270600000 |
| Friday, January 1, 2021 | 603944000 | 2446300000 |
| Saturday, January 1, 2022 | 644577000 | 2545900000 |
| Sunday, January 1, 2023 | 677006000 | 2963200000 |
| Monday, January 1, 2024 | 696905000 | 3580400000 |
In pursuit of knowledge
In the competitive landscape of industrial manufacturing, Trane Technologies plc and AMETEK, Inc. have showcased distinct trajectories in their Selling, General, and Administrative (SG&A) expenses over the past decade. From 2014 to 2023, Trane Technologies consistently reported higher SG&A expenses, peaking in 2019 with a 25% increase from 2014. Meanwhile, AMETEK's expenses grew steadily, culminating in a 46% rise by 2023. This divergence highlights Trane's expansive operational scale compared to AMETEK's more conservative growth strategy. The data suggests that while Trane invests heavily in administrative and sales functions, AMETEK maintains a leaner approach, potentially reflecting differing market strategies and operational efficiencies. As these industry leaders continue to evolve, their SG&A trends offer valuable insights into their strategic priorities and market positioning.
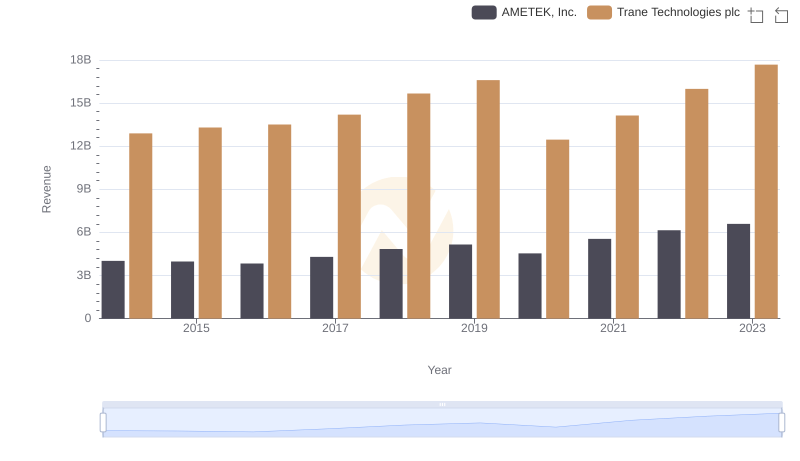
Trane Technologies plc vs AMETEK, Inc.: Annual Revenue Growth Compared
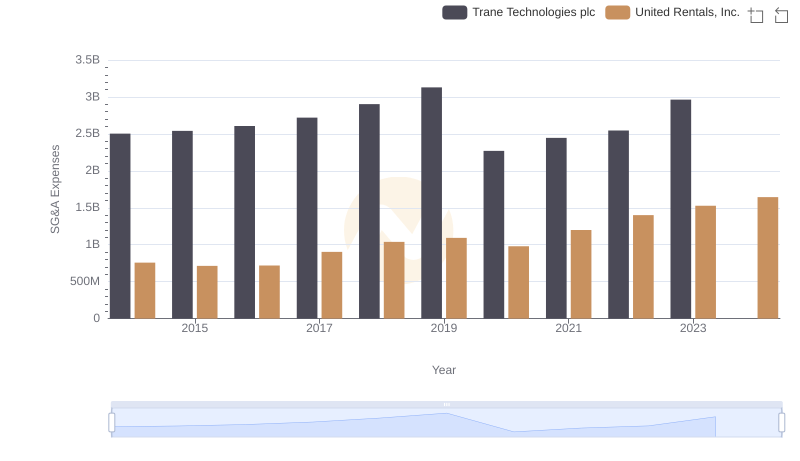
Trane Technologies plc or United Rentals, Inc.: Who Manages SG&A Costs Better?
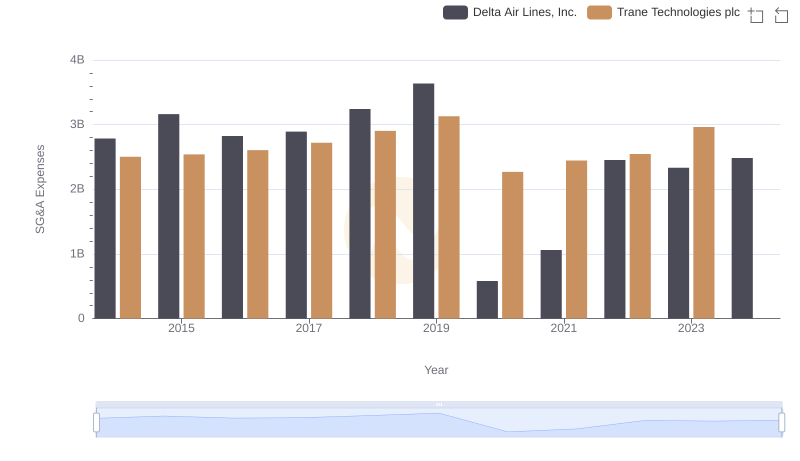
SG&A Efficiency Analysis: Comparing Trane Technologies plc and Delta Air Lines, Inc.
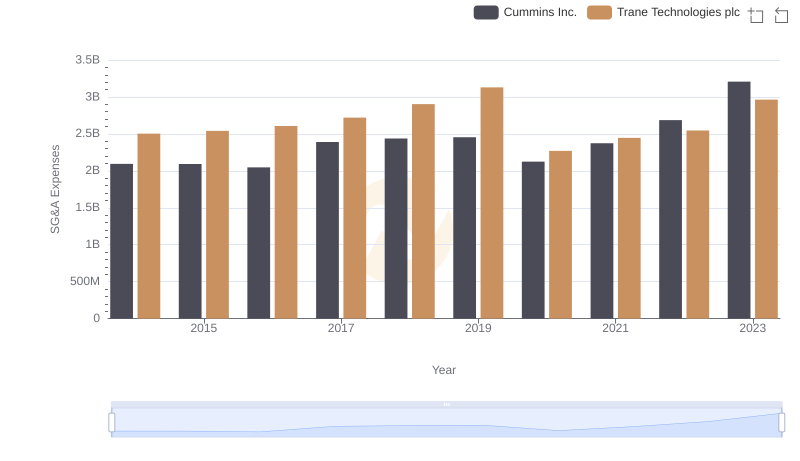
Trane Technologies plc or Cummins Inc.: Who Manages SG&A Costs Better?
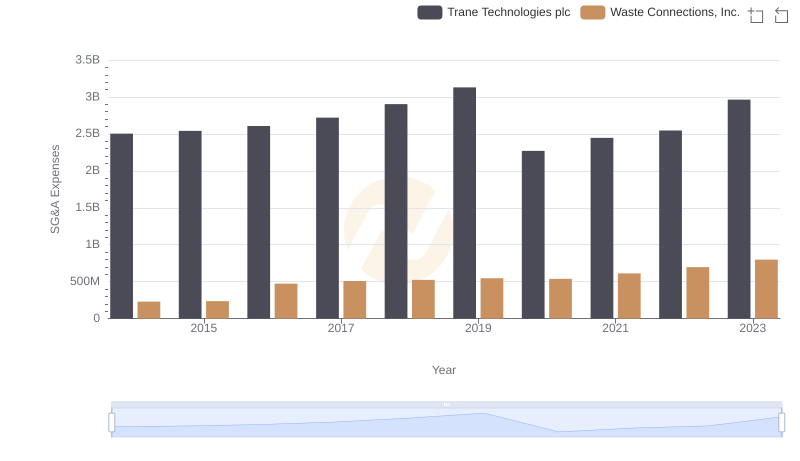
Cost Management Insights: SG&A Expenses for Trane Technologies plc and Waste Connections, Inc.
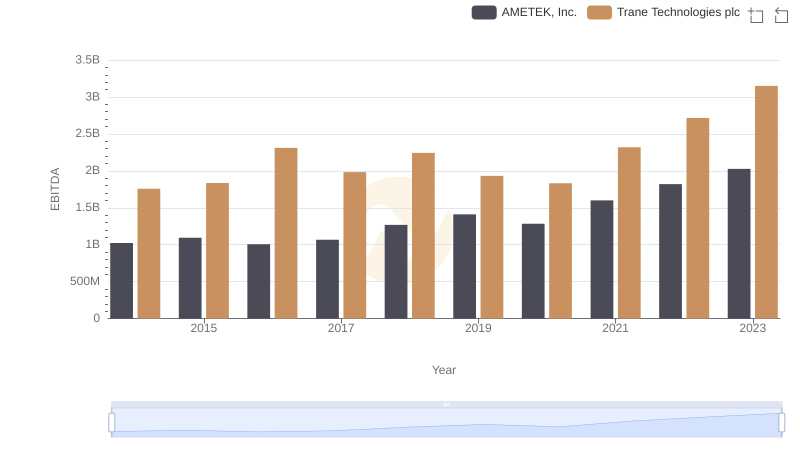
EBITDA Performance Review: Trane Technologies plc vs AMETEK, Inc.