| __timestamp | RB Global, Inc. | Rockwell Automation, Inc. |
|---|---|---|
| Wednesday, January 1, 2014 | 248220000 | 1570100000 |
| Thursday, January 1, 2015 | 254990000 | 1506400000 |
| Friday, January 1, 2016 | 283529000 | 1467400000 |
| Sunday, January 1, 2017 | 323270000 | 1591500000 |
| Monday, January 1, 2018 | 382676000 | 1599000000 |
| Tuesday, January 1, 2019 | 382389000 | 1538500000 |
| Wednesday, January 1, 2020 | 417523000 | 1479800000 |
| Friday, January 1, 2021 | 464599000 | 1680000000 |
| Saturday, January 1, 2022 | 539933000 | 1766700000 |
| Sunday, January 1, 2023 | 743700000 | 2023700000 |
| Monday, January 1, 2024 | 773900000 | 2002600000 |
In pursuit of knowledge
In the ever-evolving landscape of industrial automation and global asset management, understanding the efficiency of Selling, General, and Administrative (SG&A) expenses is crucial. Rockwell Automation, Inc. and RB Global, Inc. have been at the forefront of this analysis since 2014. Over the past decade, Rockwell Automation has consistently maintained higher SG&A expenses, peaking at approximately $2 billion in 2023, reflecting its expansive operations and market reach. In contrast, RB Global's SG&A expenses have shown a significant upward trend, surging by nearly 200% from 2014 to 2023, reaching around $743 million. This growth highlights RB Global's aggressive expansion strategy. However, the data for 2024 is incomplete, leaving room for speculation on future trends. As these industry leaders continue to evolve, monitoring their SG&A efficiency will provide valuable insights into their operational strategies and market positioning.
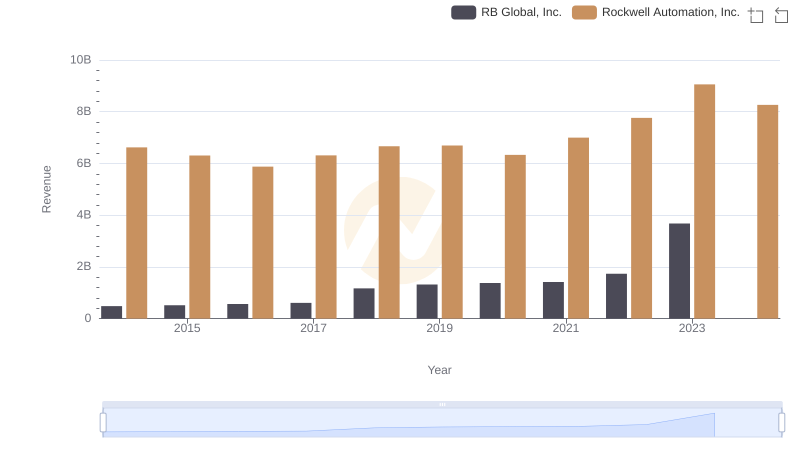
Rockwell Automation, Inc. and RB Global, Inc.: A Comprehensive Revenue Analysis
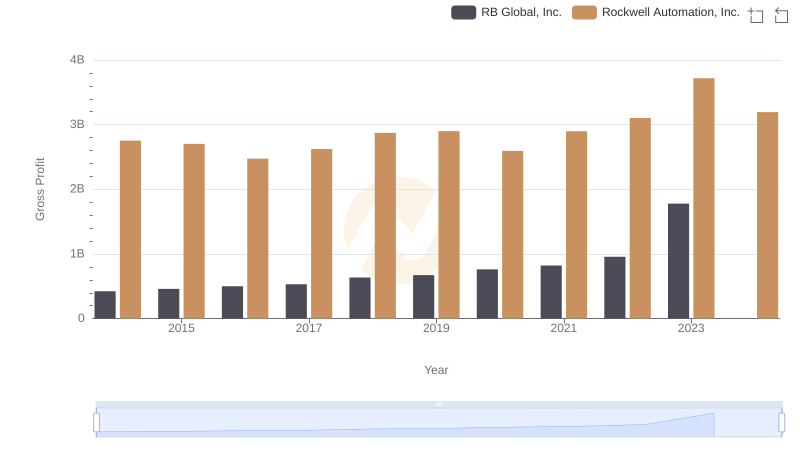
Gross Profit Trends Compared: Rockwell Automation, Inc. vs RB Global, Inc.
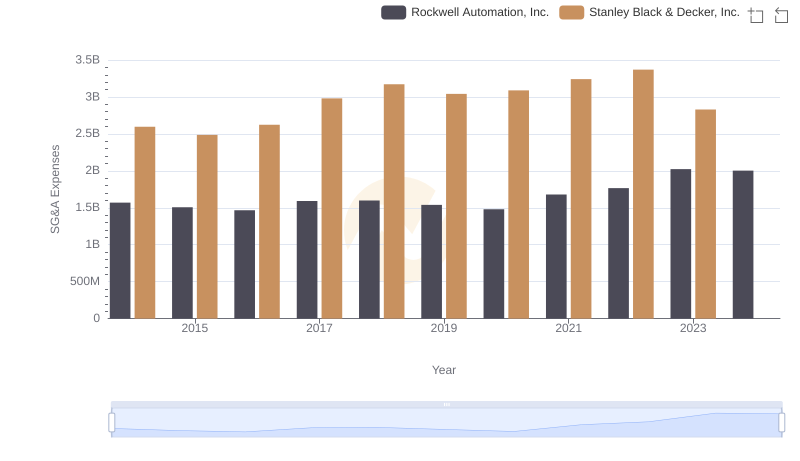
Selling, General, and Administrative Costs: Rockwell Automation, Inc. vs Stanley Black & Decker, Inc.
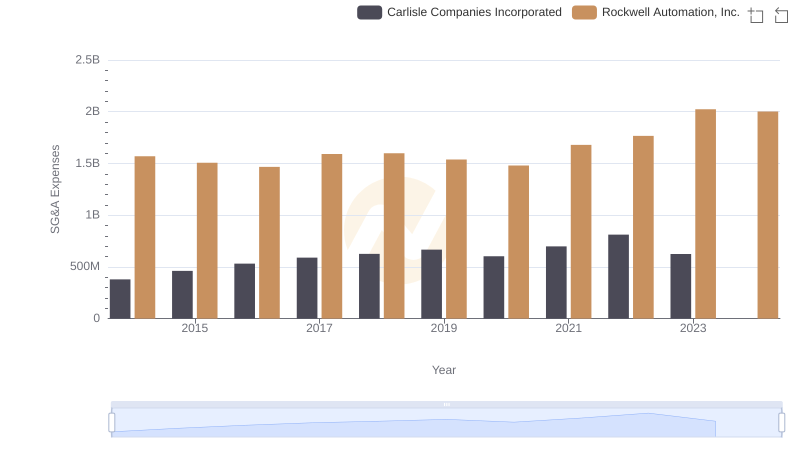
SG&A Efficiency Analysis: Comparing Rockwell Automation, Inc. and Carlisle Companies Incorporated
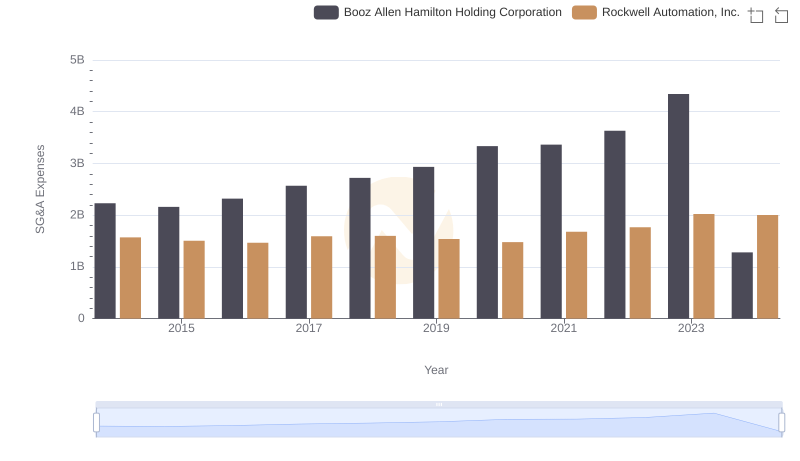
SG&A Efficiency Analysis: Comparing Rockwell Automation, Inc. and Booz Allen Hamilton Holding Corporation
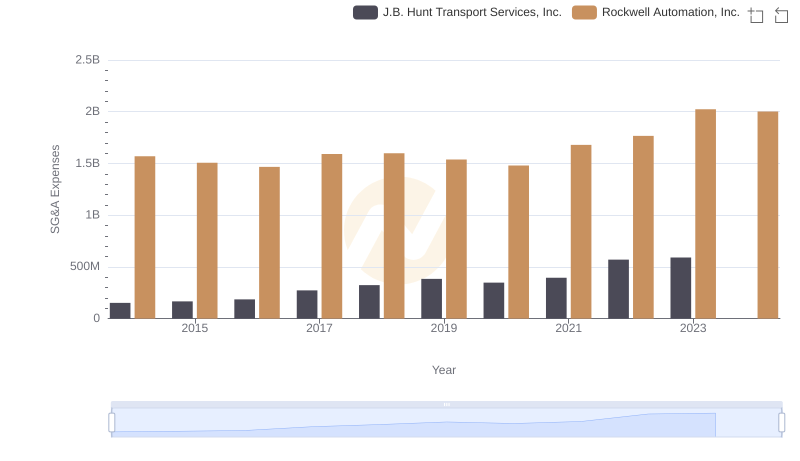
Breaking Down SG&A Expenses: Rockwell Automation, Inc. vs J.B. Hunt Transport Services, Inc.
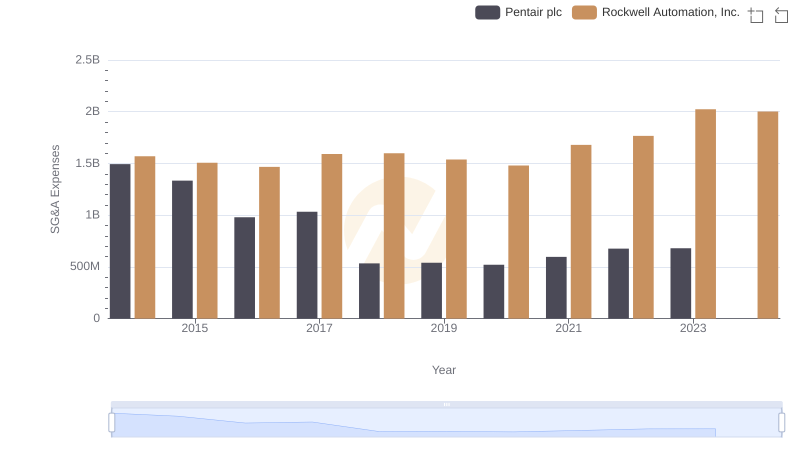
Rockwell Automation, Inc. vs Pentair plc: SG&A Expense Trends
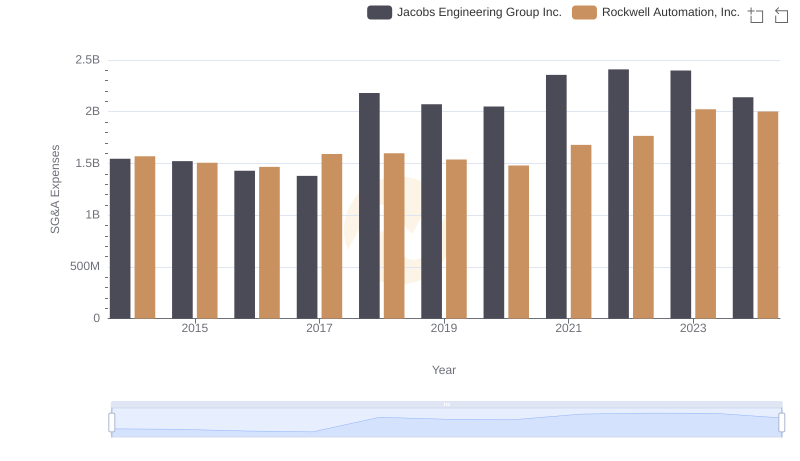
Rockwell Automation, Inc. vs Jacobs Engineering Group Inc.: SG&A Expense Trends
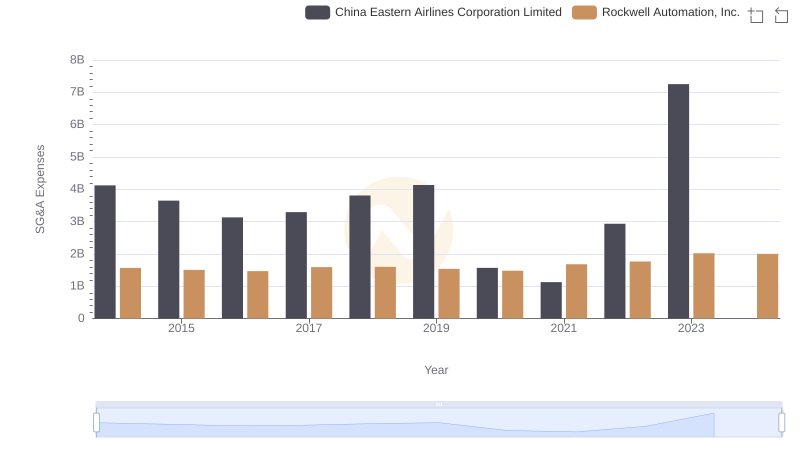
Breaking Down SG&A Expenses: Rockwell Automation, Inc. vs China Eastern Airlines Corporation Limited
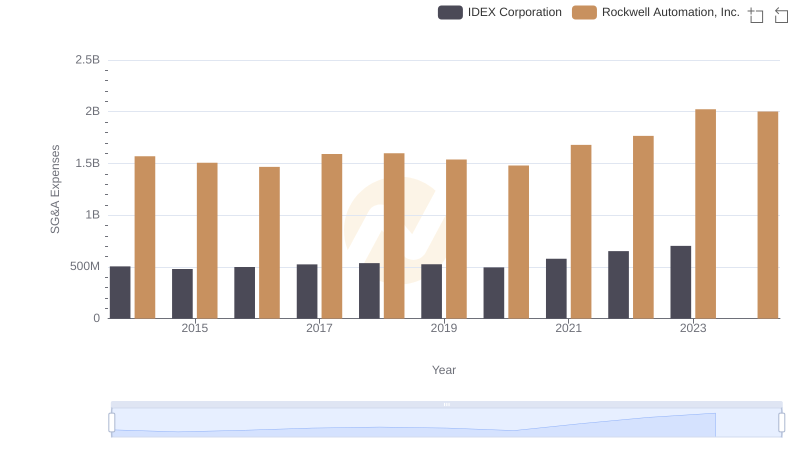
Breaking Down SG&A Expenses: Rockwell Automation, Inc. vs IDEX Corporation
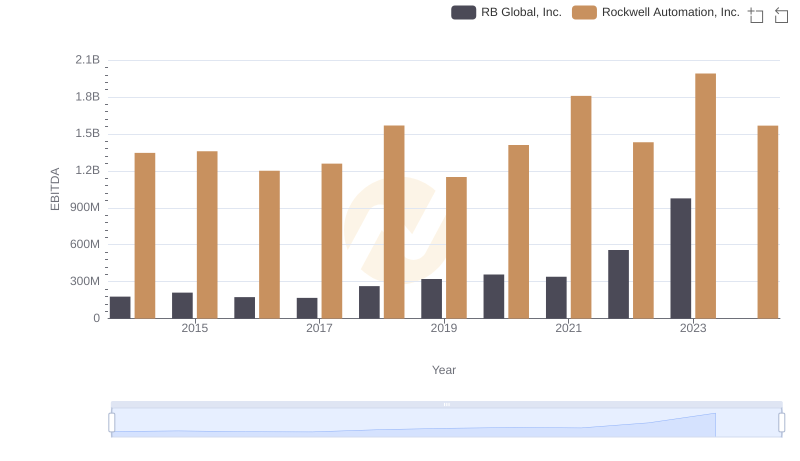
Rockwell Automation, Inc. and RB Global, Inc.: A Detailed Examination of EBITDA Performance