| __timestamp | Jacobs Engineering Group Inc. | Rockwell Automation, Inc. |
|---|---|---|
| Wednesday, January 1, 2014 | 1545716000 | 1570100000 |
| Thursday, January 1, 2015 | 1522811000 | 1506400000 |
| Friday, January 1, 2016 | 1429233000 | 1467400000 |
| Sunday, January 1, 2017 | 1379983000 | 1591500000 |
| Monday, January 1, 2018 | 2180399000 | 1599000000 |
| Tuesday, January 1, 2019 | 2072177000 | 1538500000 |
| Wednesday, January 1, 2020 | 2050695000 | 1479800000 |
| Friday, January 1, 2021 | 2355683000 | 1680000000 |
| Saturday, January 1, 2022 | 2409190000 | 1766700000 |
| Sunday, January 1, 2023 | 2398078000 | 2023700000 |
| Monday, January 1, 2024 | 2140320000 | 2002600000 |
Unleashing insights
In the ever-evolving landscape of industrial automation and engineering, understanding the financial health of key players is crucial. This analysis delves into the Selling, General, and Administrative (SG&A) expenses of Rockwell Automation, Inc. and Jacobs Engineering Group Inc. from 2014 to 2024.
Over the past decade, Jacobs Engineering has seen a significant increase in SG&A expenses, peaking in 2022 with a 74% rise from 2014. In contrast, Rockwell Automation's expenses have grown more modestly, with a 29% increase over the same period. Notably, 2023 marked a pivotal year for Rockwell, as its SG&A expenses surged by 15% compared to the previous year, reaching a new high.
These trends highlight the strategic investments and operational shifts within these companies, reflecting their responses to market demands and technological advancements.
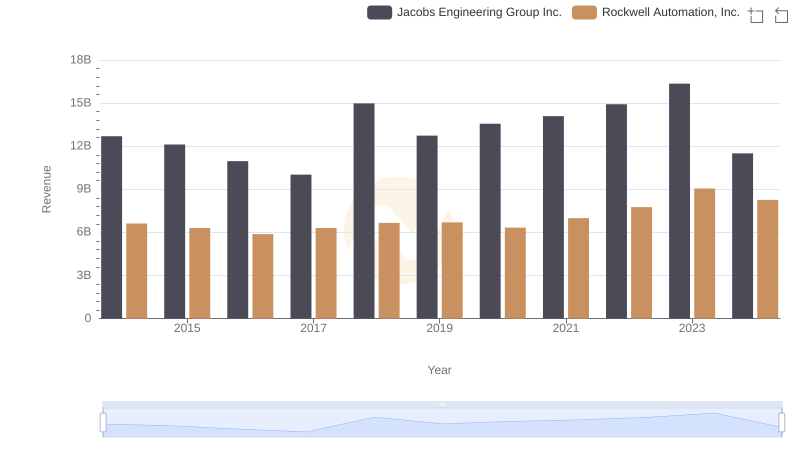
Rockwell Automation, Inc. vs Jacobs Engineering Group Inc.: Annual Revenue Growth Compared
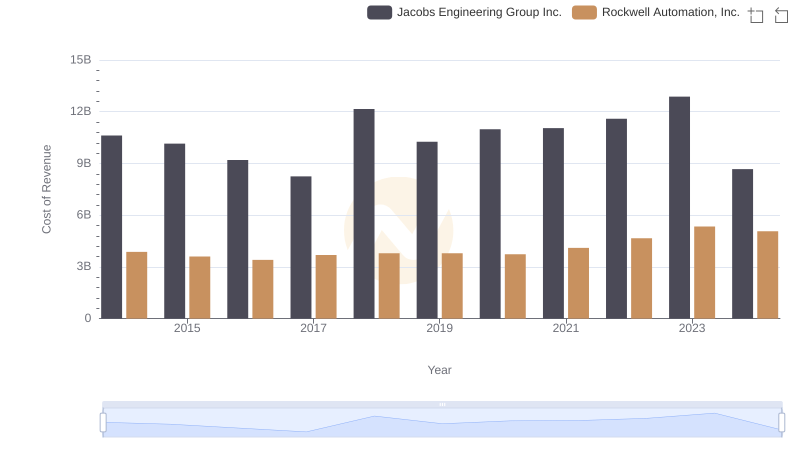
Cost of Revenue: Key Insights for Rockwell Automation, Inc. and Jacobs Engineering Group Inc.
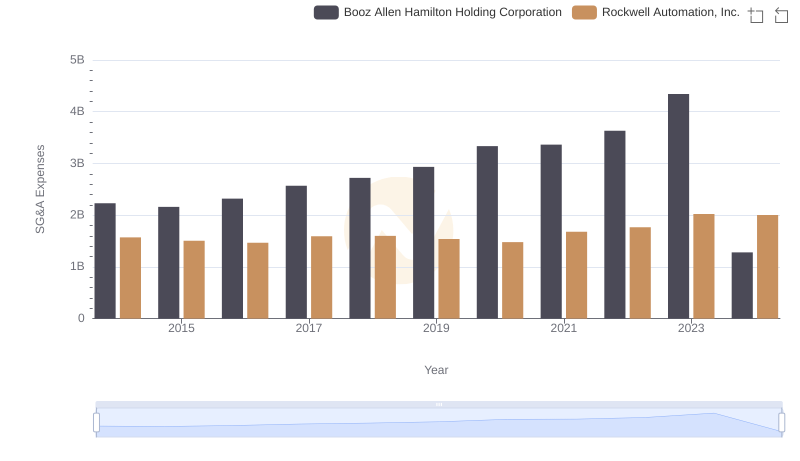
SG&A Efficiency Analysis: Comparing Rockwell Automation, Inc. and Booz Allen Hamilton Holding Corporation
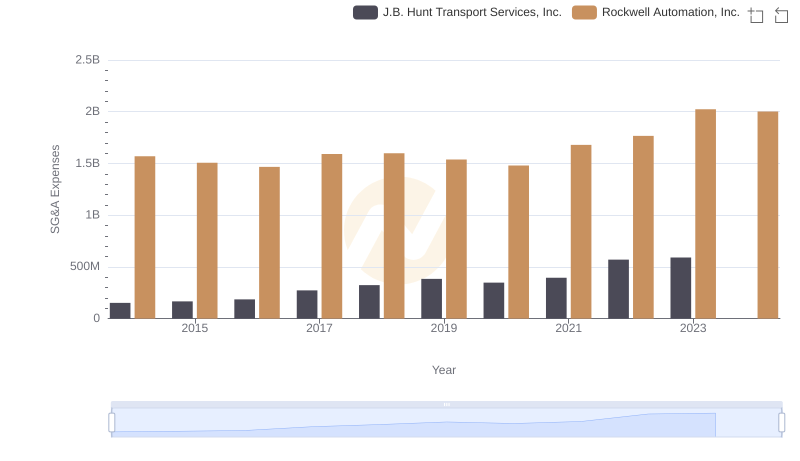
Breaking Down SG&A Expenses: Rockwell Automation, Inc. vs J.B. Hunt Transport Services, Inc.
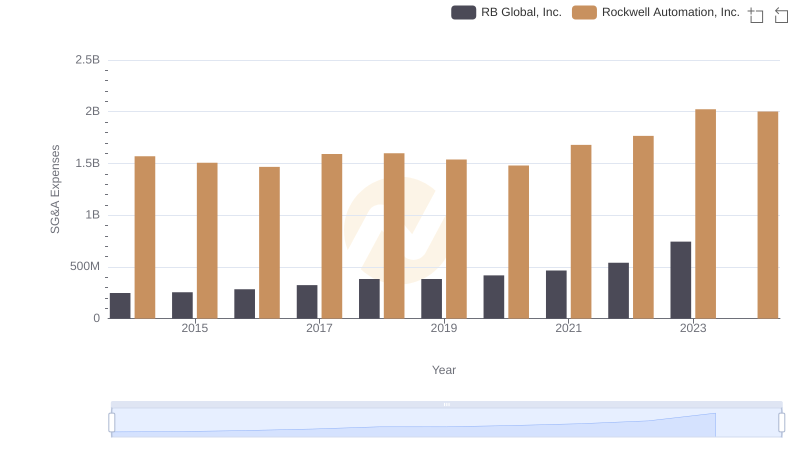
SG&A Efficiency Analysis: Comparing Rockwell Automation, Inc. and RB Global, Inc.
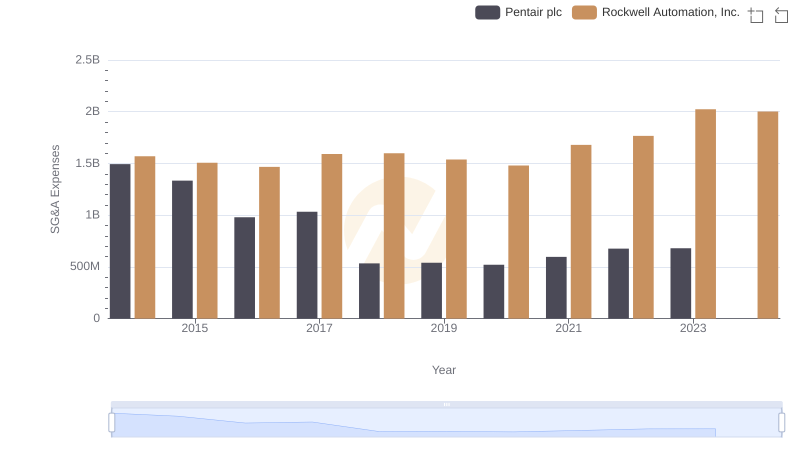
Rockwell Automation, Inc. vs Pentair plc: SG&A Expense Trends
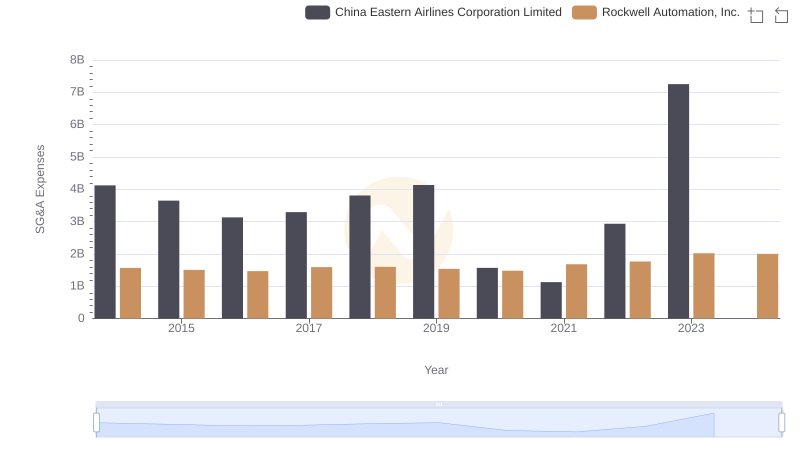
Breaking Down SG&A Expenses: Rockwell Automation, Inc. vs China Eastern Airlines Corporation Limited
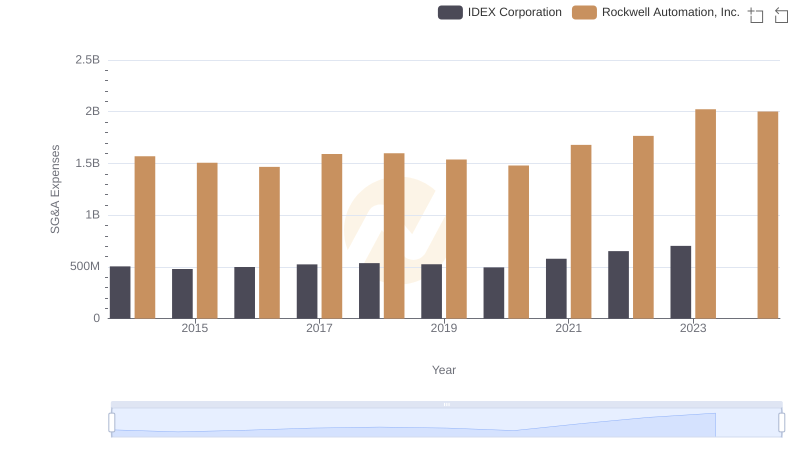
Breaking Down SG&A Expenses: Rockwell Automation, Inc. vs IDEX Corporation
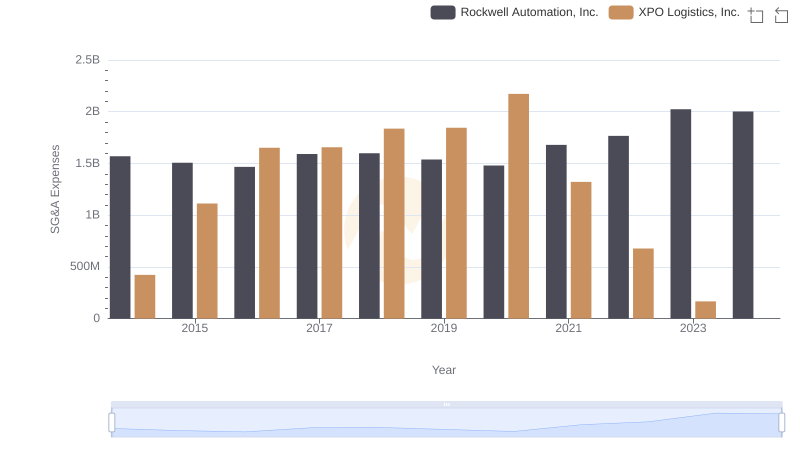
Rockwell Automation, Inc. or XPO Logistics, Inc.: Who Manages SG&A Costs Better?

Cost Management Insights: SG&A Expenses for Rockwell Automation, Inc. and Expeditors International of Washington, Inc.
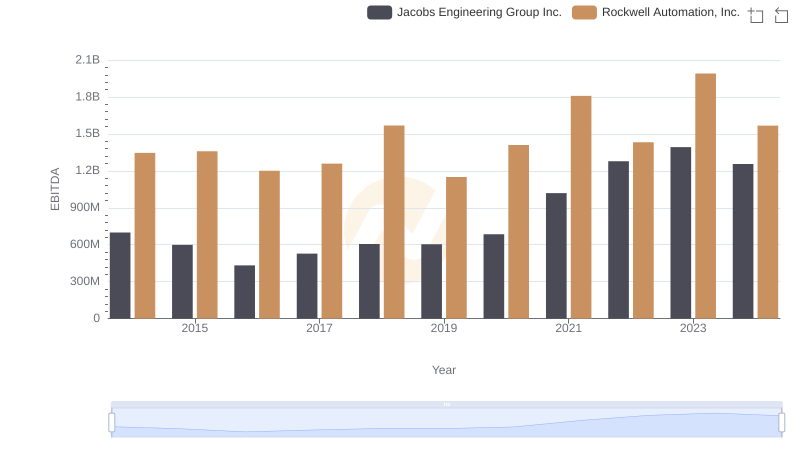
Rockwell Automation, Inc. vs Jacobs Engineering Group Inc.: In-Depth EBITDA Performance Comparison