| __timestamp | Rockwell Automation, Inc. | Stanley Black & Decker, Inc. |
|---|---|---|
| Wednesday, January 1, 2014 | 1570100000 | 2595900000 |
| Thursday, January 1, 2015 | 1506400000 | 2486400000 |
| Friday, January 1, 2016 | 1467400000 | 2623900000 |
| Sunday, January 1, 2017 | 1591500000 | 2980100000 |
| Monday, January 1, 2018 | 1599000000 | 3171700000 |
| Tuesday, January 1, 2019 | 1538500000 | 3041000000 |
| Wednesday, January 1, 2020 | 1479800000 | 3089600000 |
| Friday, January 1, 2021 | 1680000000 | 3240400000 |
| Saturday, January 1, 2022 | 1766700000 | 3370000000 |
| Sunday, January 1, 2023 | 2023700000 | 2829300000 |
| Monday, January 1, 2024 | 2002600000 | 3310500000 |
Unlocking the unknown
In the ever-evolving landscape of industrial automation and tools, understanding the financial dynamics of key players is crucial. Over the past decade, Rockwell Automation and Stanley Black & Decker have showcased distinct trends in their Selling, General, and Administrative (SG&A) expenses. From 2014 to 2023, Rockwell Automation's SG&A costs have seen a steady increase, peaking at approximately $2 billion in 2023, marking a 29% rise from 2014. In contrast, Stanley Black & Decker's expenses fluctuated, reaching a high of $3.37 billion in 2022 before dropping to $2.83 billion in 2023. This 16% decline in the last year highlights potential strategic shifts or market challenges. Such insights are invaluable for investors and industry analysts aiming to gauge the operational efficiency and strategic priorities of these industrial giants.
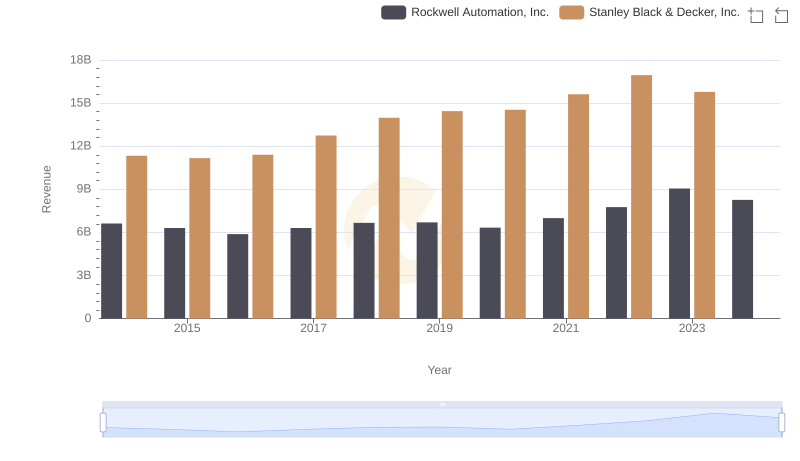
Who Generates More Revenue? Rockwell Automation, Inc. or Stanley Black & Decker, Inc.

Comparing Cost of Revenue Efficiency: Rockwell Automation, Inc. vs Stanley Black & Decker, Inc.

Who Generates Higher Gross Profit? Rockwell Automation, Inc. or Stanley Black & Decker, Inc.
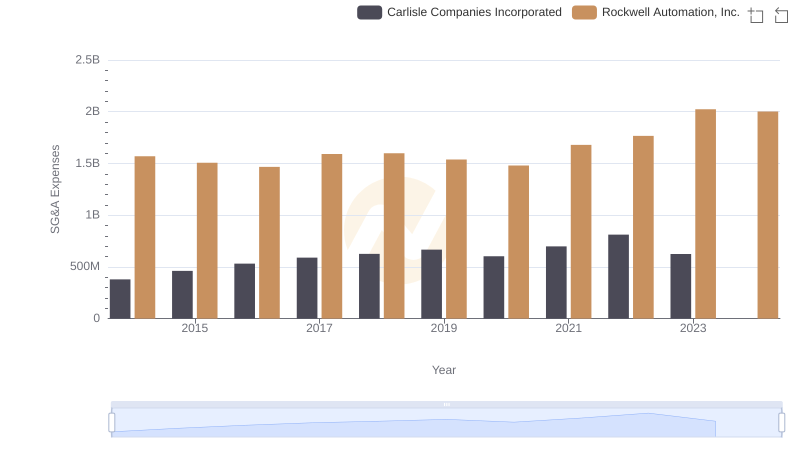
SG&A Efficiency Analysis: Comparing Rockwell Automation, Inc. and Carlisle Companies Incorporated
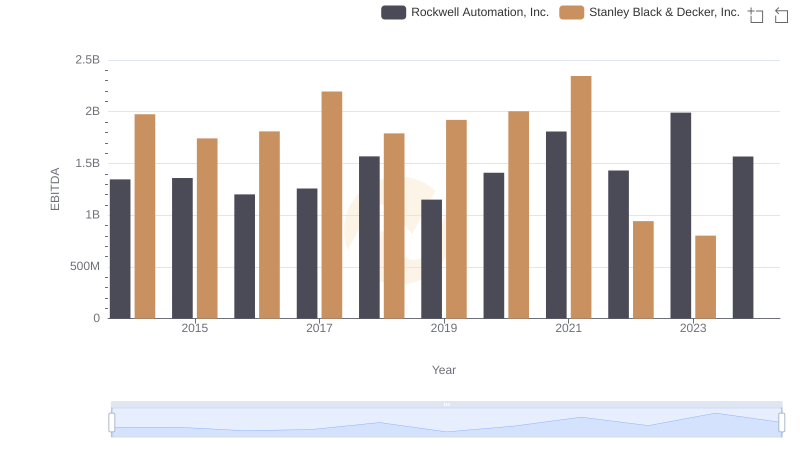
Rockwell Automation, Inc. and Stanley Black & Decker, Inc.: A Detailed Examination of EBITDA Performance
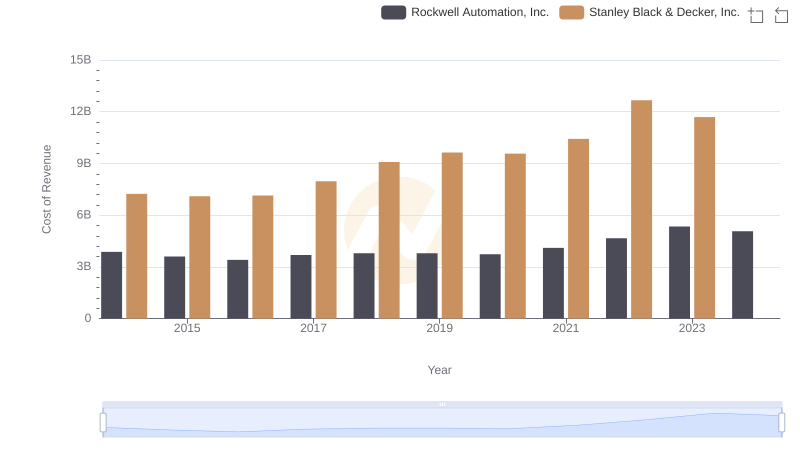
Rockwell Automation, Inc. vs Stanley Black & Decker, Inc.: Efficiency in Cost of Revenue Explored
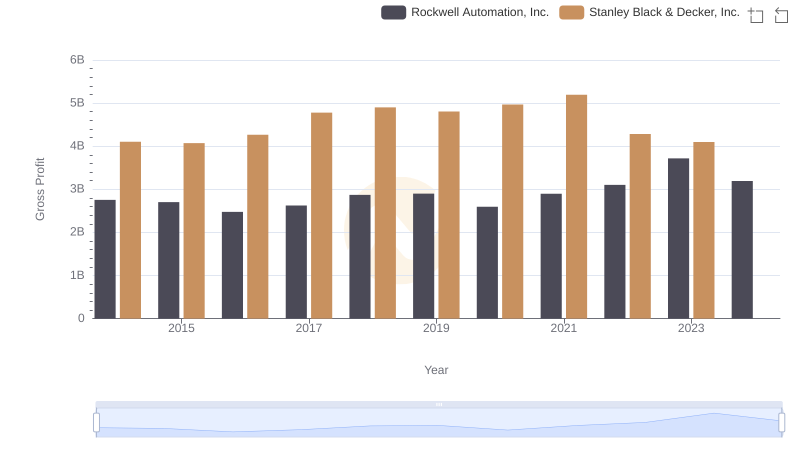
Who Generates Higher Gross Profit? Rockwell Automation, Inc. or Stanley Black & Decker, Inc.
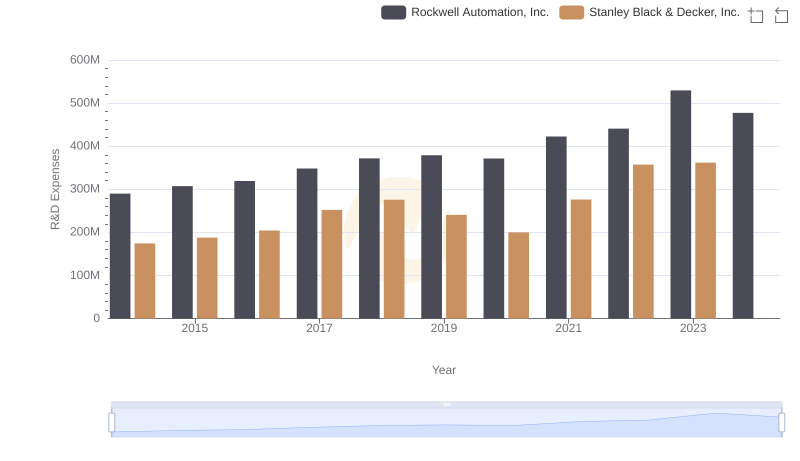
Rockwell Automation, Inc. or Stanley Black & Decker, Inc.: Who Invests More in Innovation?

Who Optimizes SG&A Costs Better? Rockwell Automation, Inc. or Stanley Black & Decker, Inc.

Comprehensive EBITDA Comparison: Rockwell Automation, Inc. vs Stanley Black & Decker, Inc.