| __timestamp | RB Global, Inc. | Rockwell Automation, Inc. |
|---|---|---|
| Wednesday, January 1, 2014 | 178851000 | 1346000000 |
| Thursday, January 1, 2015 | 211417000 | 1359100000 |
| Friday, January 1, 2016 | 174791291 | 1200700000 |
| Sunday, January 1, 2017 | 168379000 | 1258400000 |
| Monday, January 1, 2018 | 263653000 | 1568400000 |
| Tuesday, January 1, 2019 | 322140110 | 1150200000 |
| Wednesday, January 1, 2020 | 358617000 | 1410200000 |
| Friday, January 1, 2021 | 339928424 | 1808300000 |
| Saturday, January 1, 2022 | 557399151 | 1432100000 |
| Sunday, January 1, 2023 | 975874087 | 1990700000 |
| Monday, January 1, 2024 | 761100000 | 1567500000 |
Unlocking the unknown
In the ever-evolving landscape of industrial automation and global asset management, Rockwell Automation, Inc. and RB Global, Inc. have emerged as key players. Over the past decade, Rockwell Automation has consistently demonstrated robust EBITDA growth, peaking in 2023 with a 37% increase from 2014. Meanwhile, RB Global has shown remarkable resilience, with a staggering 446% rise in EBITDA from 2014 to 2023, despite a dip in 2017. This growth trajectory underscores the dynamic nature of these industries, with Rockwell Automation maintaining a steady lead, while RB Global showcases impressive catch-up potential. Notably, 2024 data for RB Global is missing, leaving room for speculation on its future performance. As these companies continue to innovate, their financial trajectories offer valuable insights into the broader economic trends shaping their respective sectors.
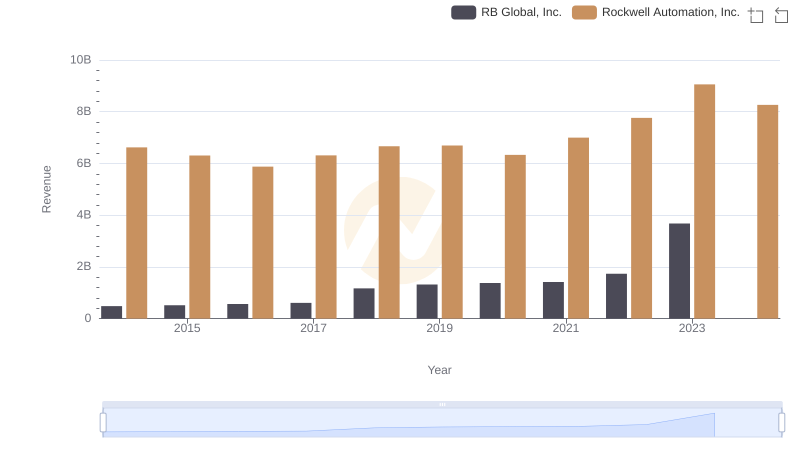
Rockwell Automation, Inc. and RB Global, Inc.: A Comprehensive Revenue Analysis
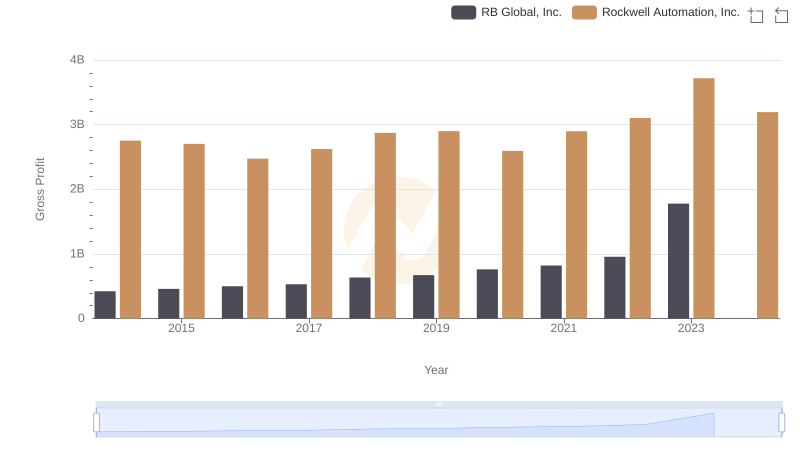
Gross Profit Trends Compared: Rockwell Automation, Inc. vs RB Global, Inc.
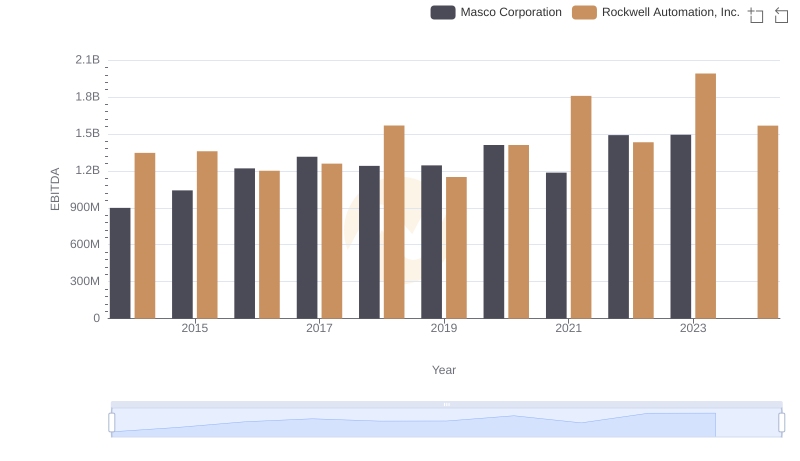
Professional EBITDA Benchmarking: Rockwell Automation, Inc. vs Masco Corporation
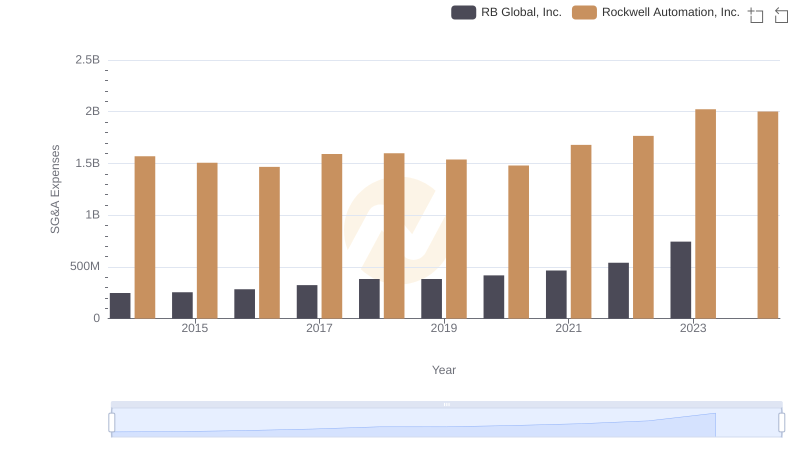
SG&A Efficiency Analysis: Comparing Rockwell Automation, Inc. and RB Global, Inc.
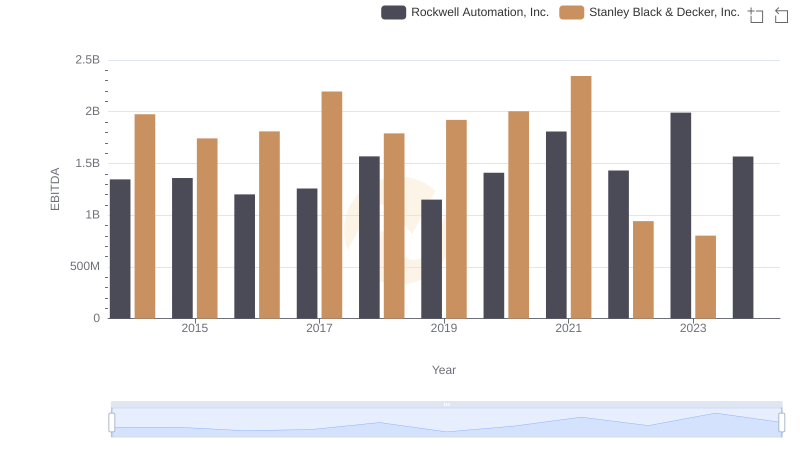
Rockwell Automation, Inc. and Stanley Black & Decker, Inc.: A Detailed Examination of EBITDA Performance

A Side-by-Side Analysis of EBITDA: Rockwell Automation, Inc. and Carlisle Companies Incorporated
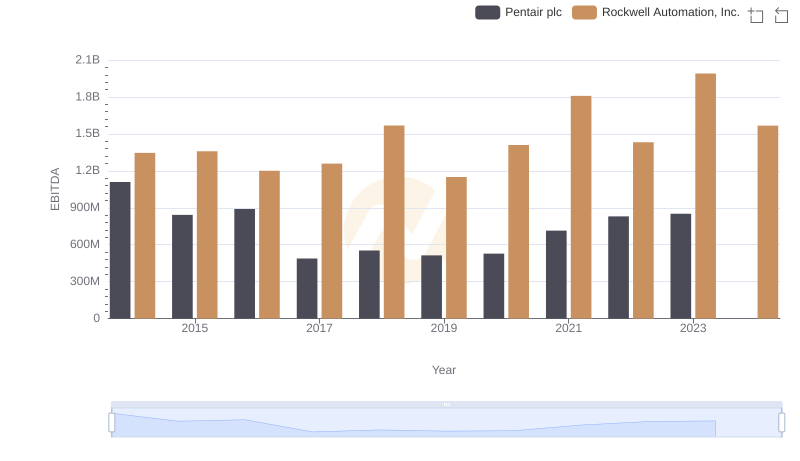
Comprehensive EBITDA Comparison: Rockwell Automation, Inc. vs Pentair plc
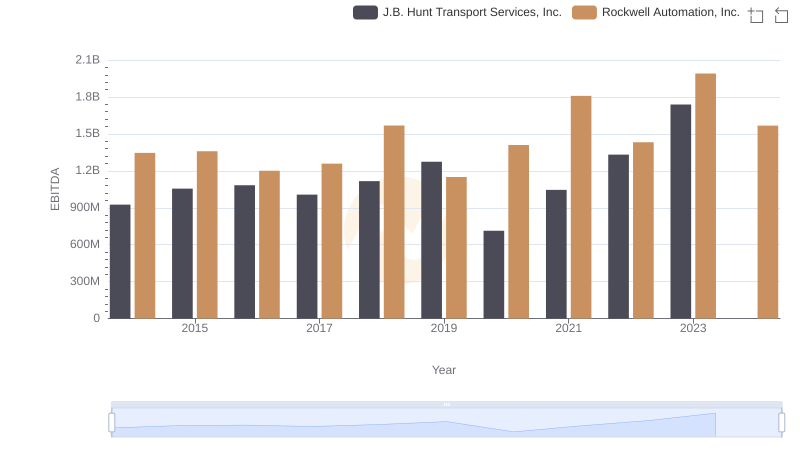
Rockwell Automation, Inc. and J.B. Hunt Transport Services, Inc.: A Detailed Examination of EBITDA Performance
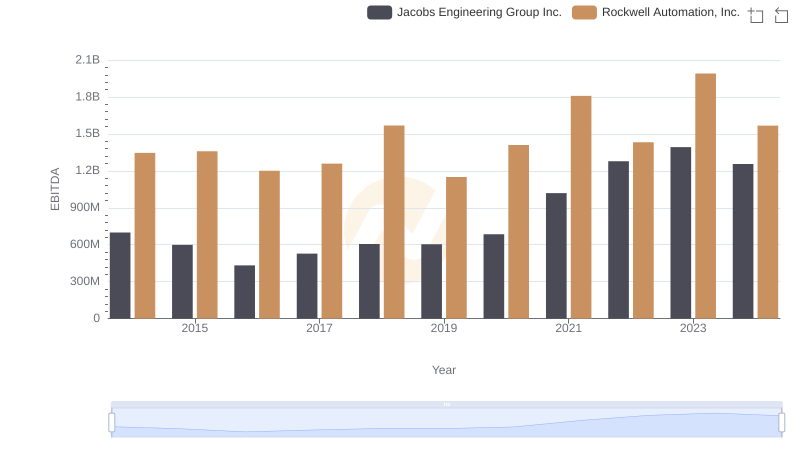
Rockwell Automation, Inc. vs Jacobs Engineering Group Inc.: In-Depth EBITDA Performance Comparison

Comprehensive EBITDA Comparison: Rockwell Automation, Inc. vs XPO Logistics, Inc.