| __timestamp | Cisco Systems, Inc. | Marvell Technology, Inc. |
|---|---|---|
| Wednesday, January 1, 2014 | 11437000000 | 259169000 |
| Thursday, January 1, 2015 | 11861000000 | 273982000 |
| Friday, January 1, 2016 | 11433000000 | 280970000 |
| Sunday, January 1, 2017 | 11177000000 | 299727000 |
| Monday, January 1, 2018 | 11386000000 | 238166000 |
| Tuesday, January 1, 2019 | 11398000000 | 424360000 |
| Wednesday, January 1, 2020 | 11094000000 | 464580000 |
| Friday, January 1, 2021 | 11411000000 | 467240000 |
| Saturday, January 1, 2022 | 11186000000 | 955245000 |
| Sunday, January 1, 2023 | 12358000000 | 843600000 |
| Monday, January 1, 2024 | 13177000000 | 834000000 |
Igniting the spark of knowledge
In the ever-evolving tech landscape, understanding operational efficiency is crucial. Cisco Systems, Inc. and Marvell Technology, Inc. offer a fascinating study in contrasts. Over the past decade, Cisco's Selling, General, and Administrative (SG&A) expenses have shown a steady trend, averaging around $11.6 billion annually. In contrast, Marvell's SG&A expenses have been significantly lower, averaging approximately $485 million per year.
From 2014 to 2024, Cisco's SG&A expenses peaked in 2024, reaching $13.2 billion, a 15% increase from 2014. Meanwhile, Marvell's expenses saw a dramatic rise in 2022, nearly doubling from the previous year, highlighting a strategic shift or expansion.
Cisco's consistent SG&A spending reflects its stable market position, while Marvell's fluctuations suggest dynamic growth strategies. Investors and analysts should consider these trends when evaluating operational efficiency and strategic direction.
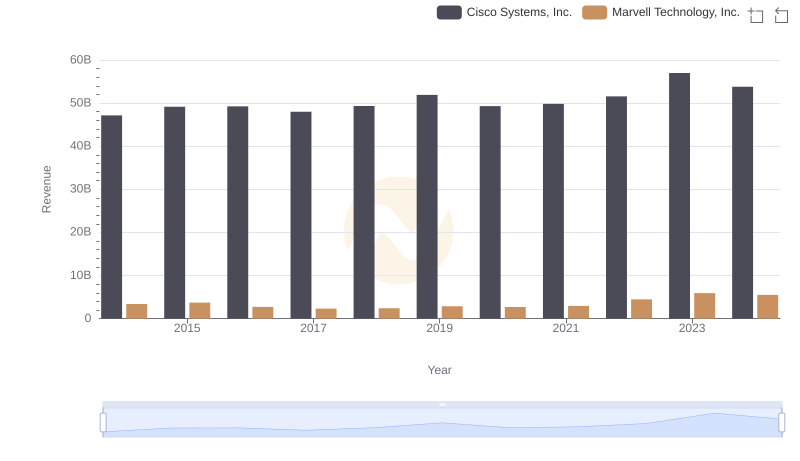
Cisco Systems, Inc. vs Marvell Technology, Inc.: Annual Revenue Growth Compared
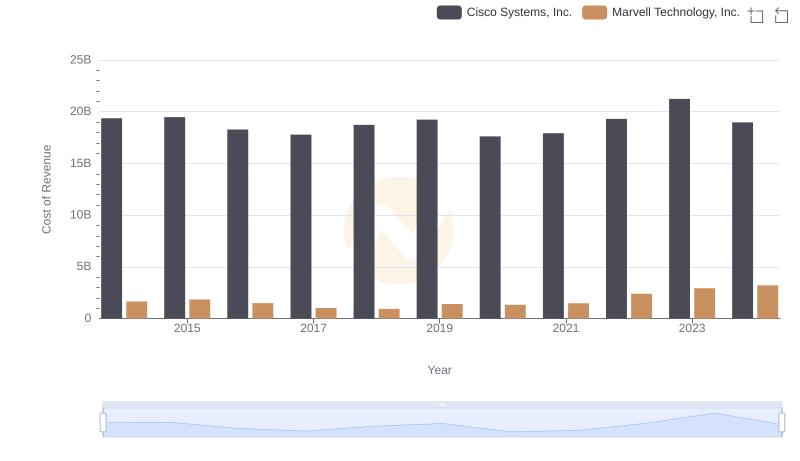
Comparing Cost of Revenue Efficiency: Cisco Systems, Inc. vs Marvell Technology, Inc.
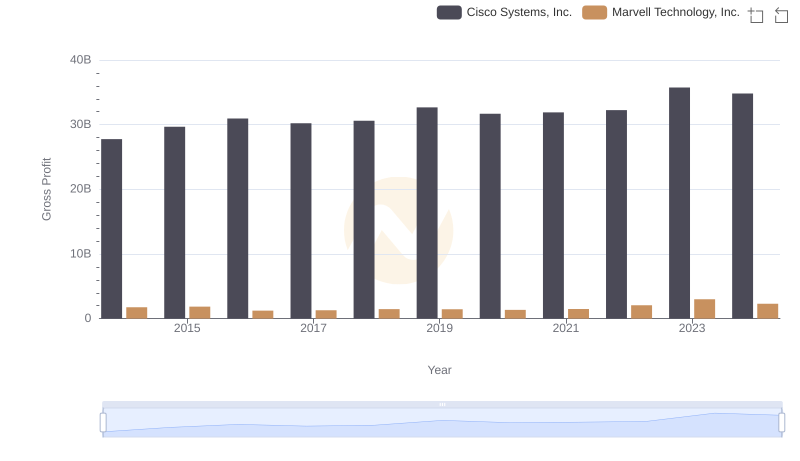
Cisco Systems, Inc. vs Marvell Technology, Inc.: A Gross Profit Performance Breakdown
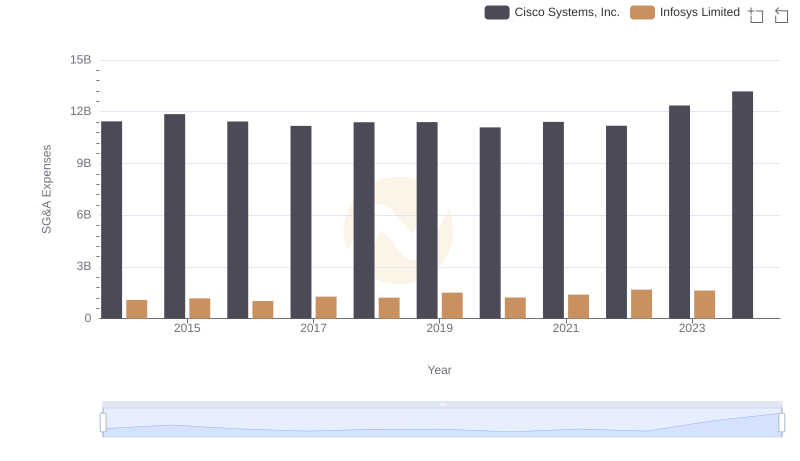
Cisco Systems, Inc. and Infosys Limited: SG&A Spending Patterns Compared
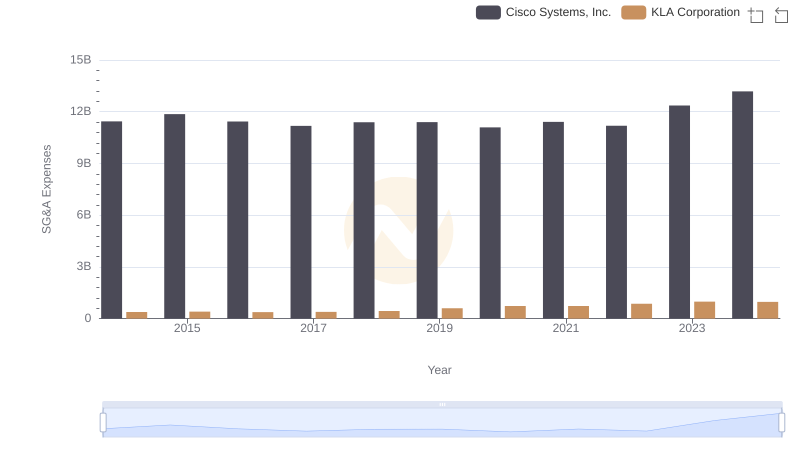
Who Optimizes SG&A Costs Better? Cisco Systems, Inc. or KLA Corporation
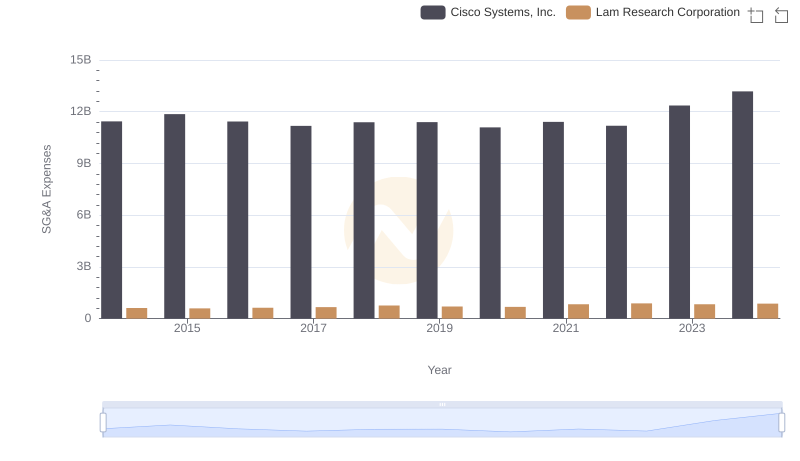
Who Optimizes SG&A Costs Better? Cisco Systems, Inc. or Lam Research Corporation
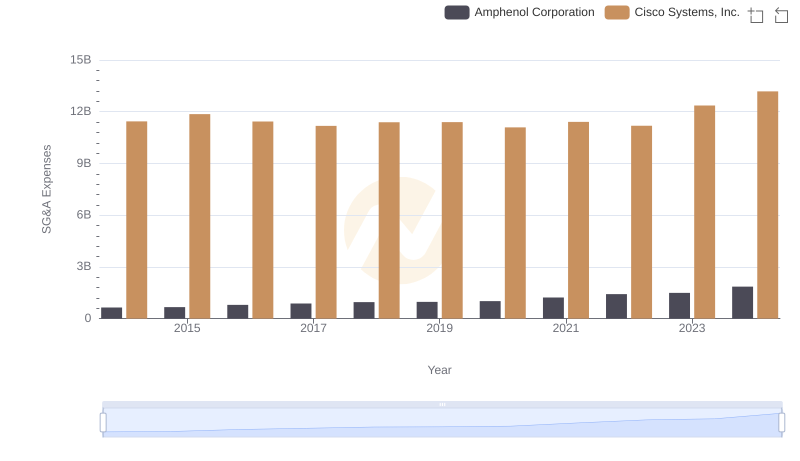
Operational Costs Compared: SG&A Analysis of Cisco Systems, Inc. and Amphenol Corporation
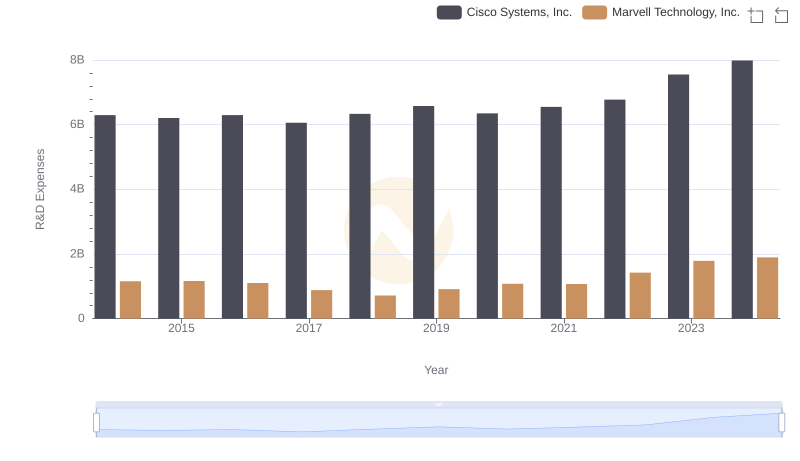
Analyzing R&D Budgets: Cisco Systems, Inc. vs Marvell Technology, Inc.
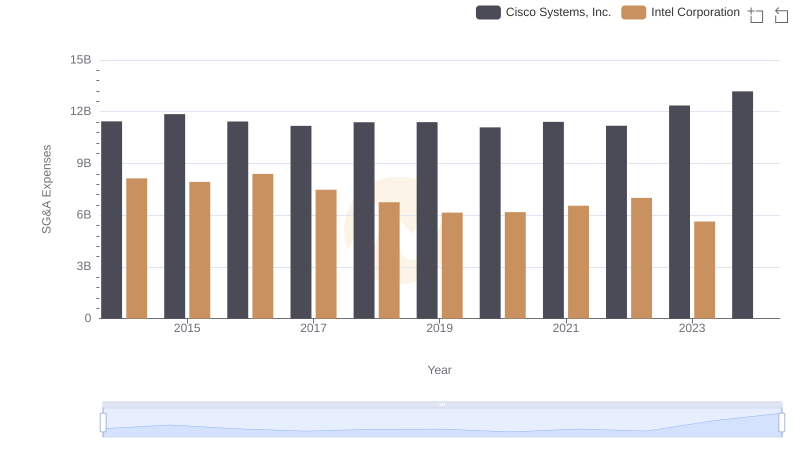
Operational Costs Compared: SG&A Analysis of Cisco Systems, Inc. and Intel Corporation
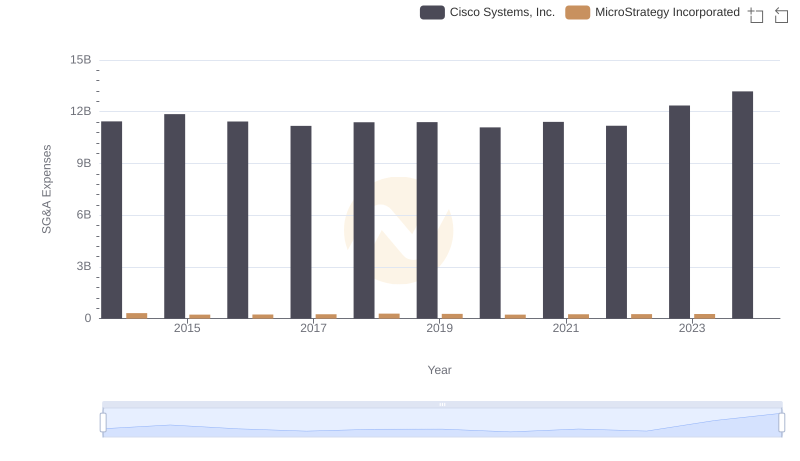
Comparing SG&A Expenses: Cisco Systems, Inc. vs MicroStrategy Incorporated Trends and Insights
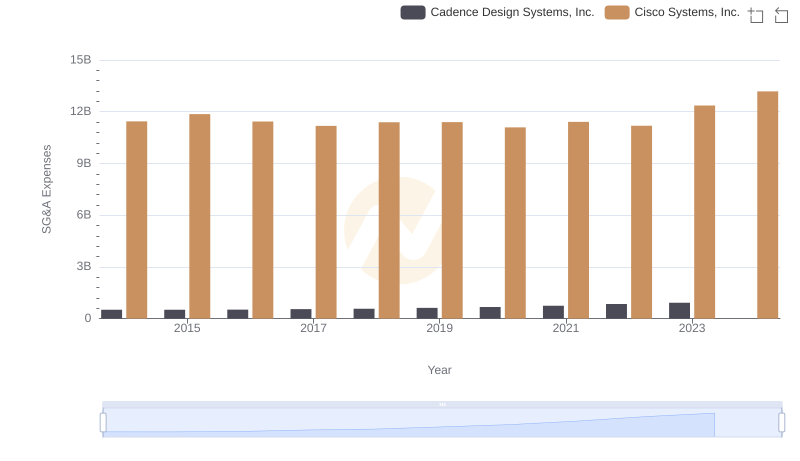
Cisco Systems, Inc. vs Cadence Design Systems, Inc.: SG&A Expense Trends
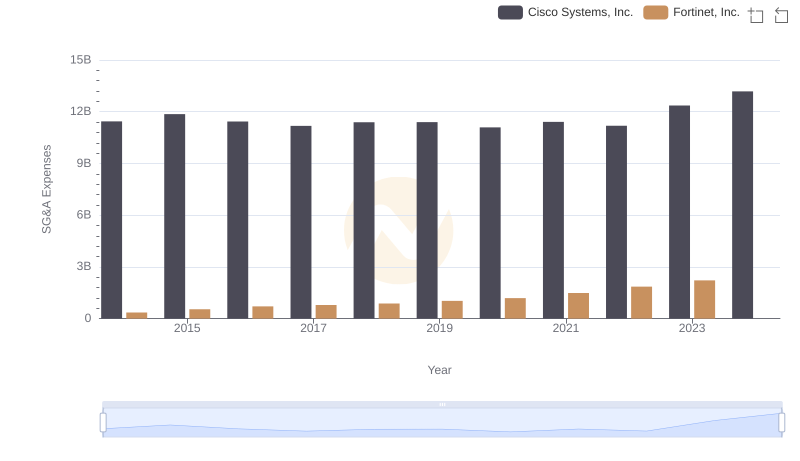
Selling, General, and Administrative Costs: Cisco Systems, Inc. vs Fortinet, Inc.