| __timestamp | Cisco Systems, Inc. | Marvell Technology, Inc. |
|---|---|---|
| Wednesday, January 1, 2014 | 27769000000 | 1750170000 |
| Thursday, January 1, 2015 | 29681000000 | 1863257000 |
| Friday, January 1, 2016 | 30960000000 | 1231092000 |
| Sunday, January 1, 2017 | 30224000000 | 1288147000 |
| Monday, January 1, 2018 | 30606000000 | 1461940000 |
| Tuesday, January 1, 2019 | 32666000000 | 1458392000 |
| Wednesday, January 1, 2020 | 31683000000 | 1356941000 |
| Friday, January 1, 2021 | 31894000000 | 1488350000 |
| Saturday, January 1, 2022 | 32248000000 | 2064225000 |
| Sunday, January 1, 2023 | 35753000000 | 2987500000 |
| Monday, January 1, 2024 | 34828000000 | 2293600000 |
Igniting the spark of knowledge
In the ever-evolving tech industry, Cisco Systems, Inc. and Marvell Technology, Inc. have showcased distinct trajectories in their gross profit performance over the past decade. From 2014 to 2024, Cisco's gross profit has consistently outpaced Marvell's, with Cisco's figures peaking at approximately $35.8 billion in 2023, marking a 29% increase from 2014. In contrast, Marvell's gross profit, while significantly smaller, has shown a remarkable growth of 71% over the same period, reaching nearly $3 billion in 2023.
This comparison highlights Cisco's steady dominance in the market, while Marvell's rapid growth underscores its potential to capture a larger market share. As the tech landscape continues to shift, these trends offer valuable insights into the strategic directions and market positions of these two industry giants.
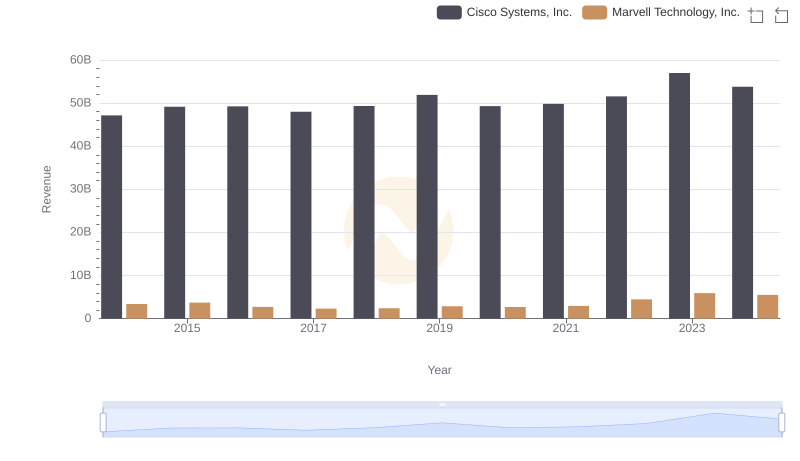
Cisco Systems, Inc. vs Marvell Technology, Inc.: Annual Revenue Growth Compared
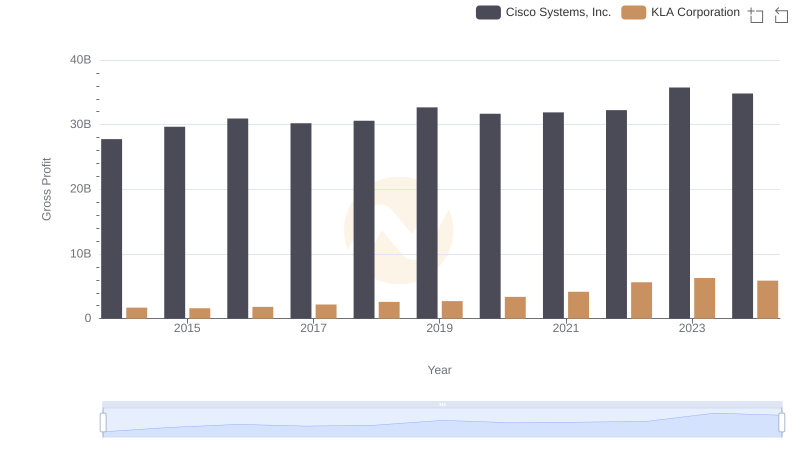
Gross Profit Comparison: Cisco Systems, Inc. and KLA Corporation Trends
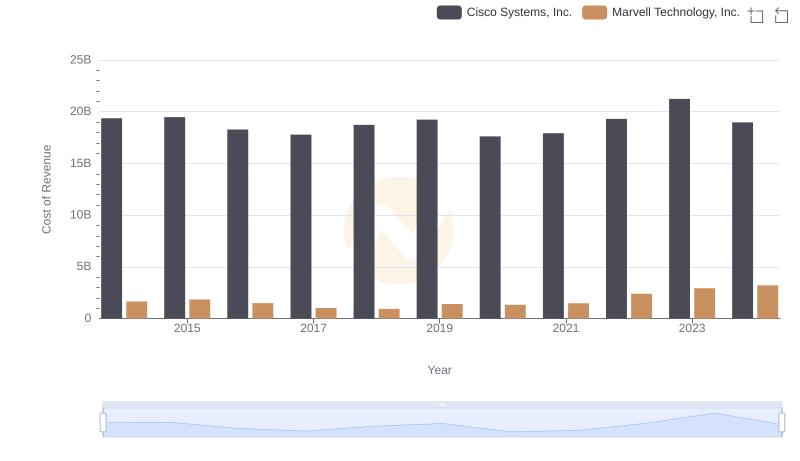
Comparing Cost of Revenue Efficiency: Cisco Systems, Inc. vs Marvell Technology, Inc.
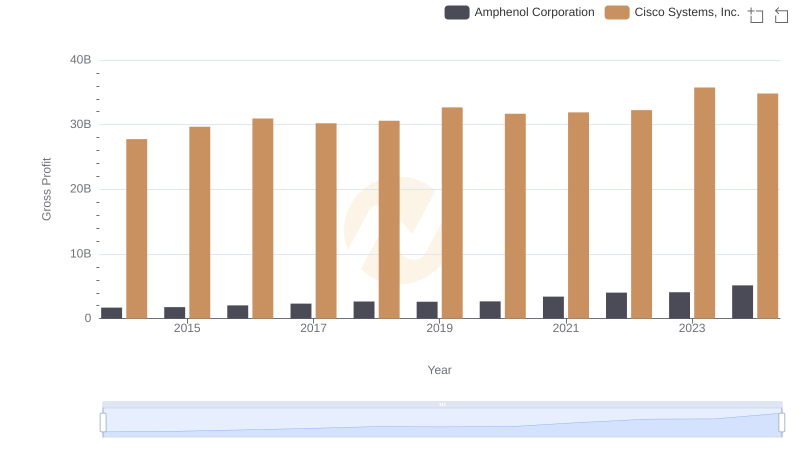
Key Insights on Gross Profit: Cisco Systems, Inc. vs Amphenol Corporation
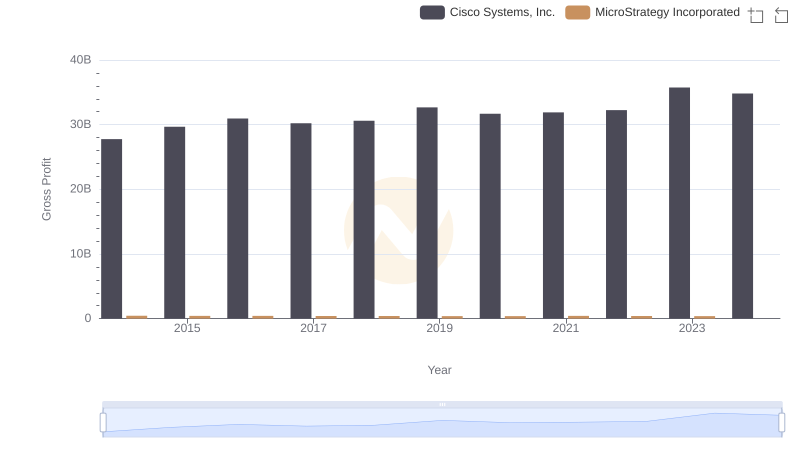
Cisco Systems, Inc. vs MicroStrategy Incorporated: A Gross Profit Performance Breakdown
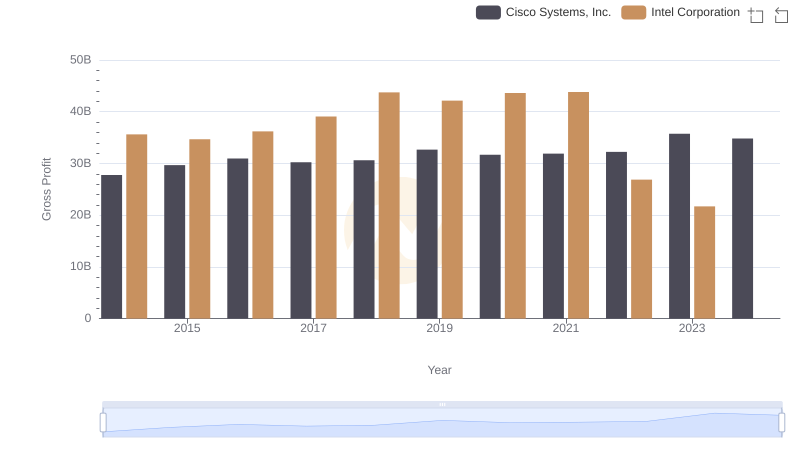
Cisco Systems, Inc. vs Intel Corporation: A Gross Profit Performance Breakdown
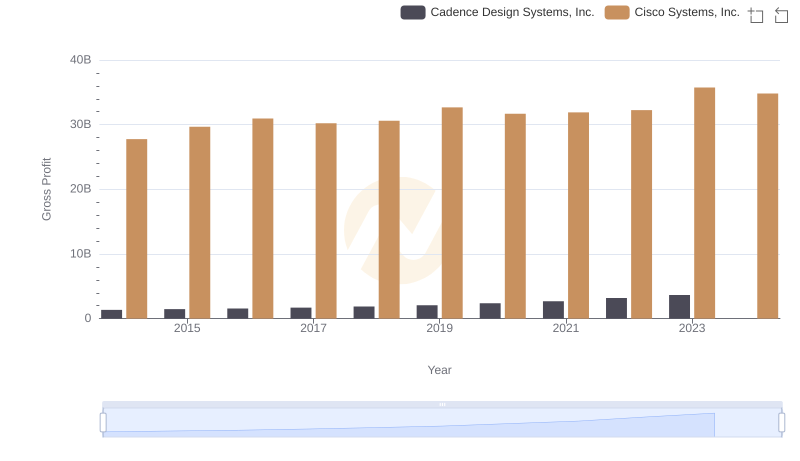
Gross Profit Analysis: Comparing Cisco Systems, Inc. and Cadence Design Systems, Inc.
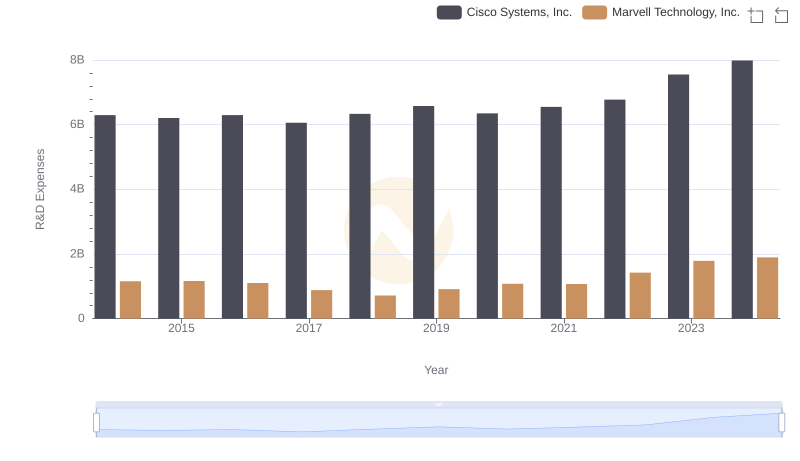
Analyzing R&D Budgets: Cisco Systems, Inc. vs Marvell Technology, Inc.
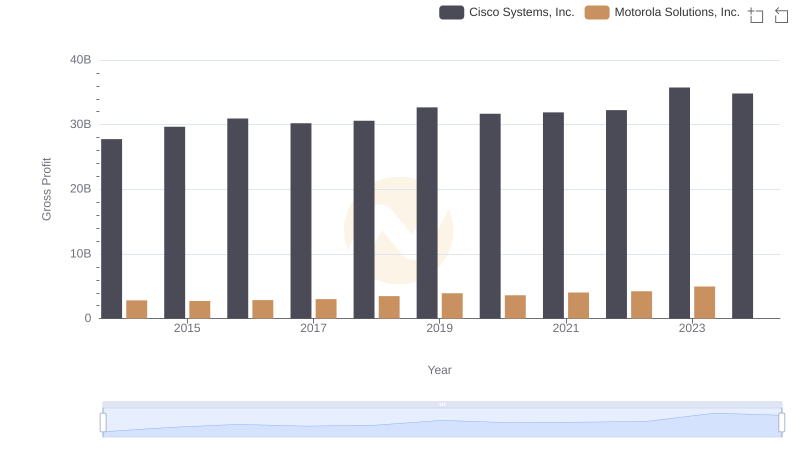
Cisco Systems, Inc. and Motorola Solutions, Inc.: A Detailed Gross Profit Analysis
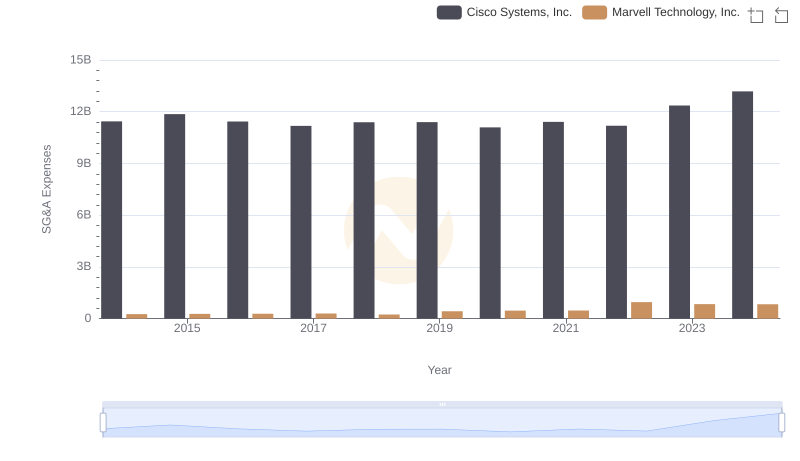
SG&A Efficiency Analysis: Comparing Cisco Systems, Inc. and Marvell Technology, Inc.

Cisco Systems, Inc. vs Synopsys, Inc.: A Gross Profit Performance Breakdown