| __timestamp | Cisco Systems, Inc. | Intel Corporation |
|---|---|---|
| Wednesday, January 1, 2014 | 11437000000 | 8136000000 |
| Thursday, January 1, 2015 | 11861000000 | 7930000000 |
| Friday, January 1, 2016 | 11433000000 | 8397000000 |
| Sunday, January 1, 2017 | 11177000000 | 7474000000 |
| Monday, January 1, 2018 | 11386000000 | 6750000000 |
| Tuesday, January 1, 2019 | 11398000000 | 6150000000 |
| Wednesday, January 1, 2020 | 11094000000 | 6180000000 |
| Friday, January 1, 2021 | 11411000000 | 6543000000 |
| Saturday, January 1, 2022 | 11186000000 | 7002000000 |
| Sunday, January 1, 2023 | 12358000000 | 5634000000 |
| Monday, January 1, 2024 | 13177000000 | 5507000000 |
Data in motion
In the ever-evolving tech industry, operational efficiency is key. Over the past decade, Cisco Systems, Inc. and Intel Corporation have showcased contrasting trends in their Selling, General, and Administrative (SG&A) expenses. Cisco's SG&A expenses have seen a steady increase, peaking at approximately $13.2 billion in 2024, marking a 15% rise from 2014. In contrast, Intel's SG&A expenses have fluctuated, with a notable decline to $5.6 billion in 2023, a 31% drop from its 2014 figures.
These trends highlight the distinct strategic approaches of these tech giants in navigating the dynamic market landscape.
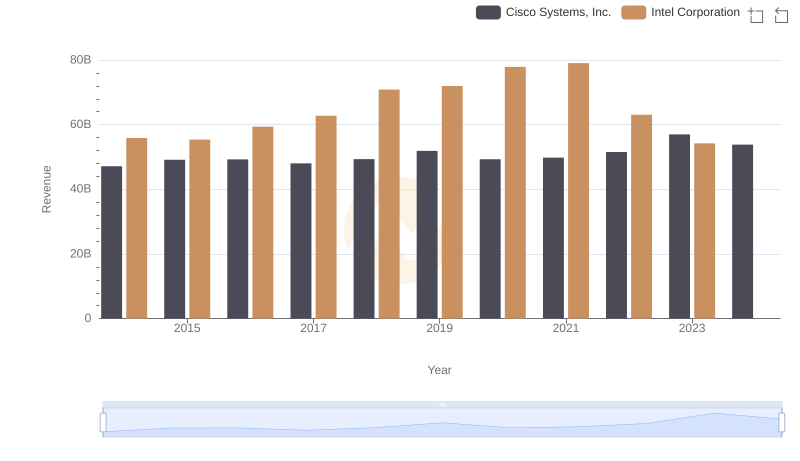
Revenue Showdown: Cisco Systems, Inc. vs Intel Corporation
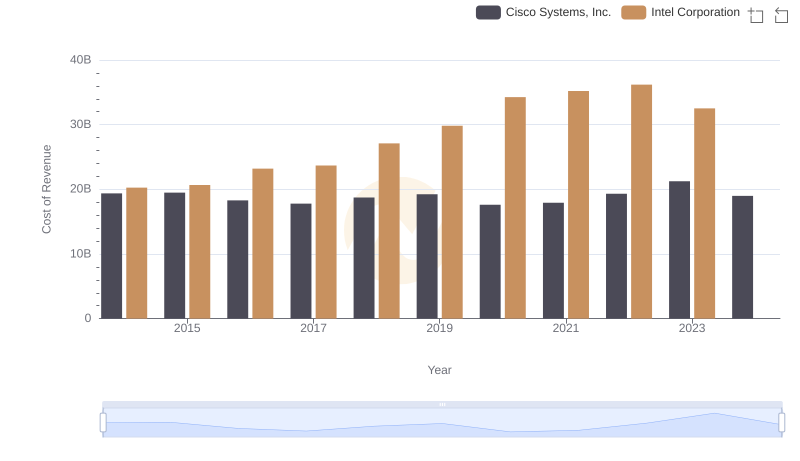
Comparing Cost of Revenue Efficiency: Cisco Systems, Inc. vs Intel Corporation
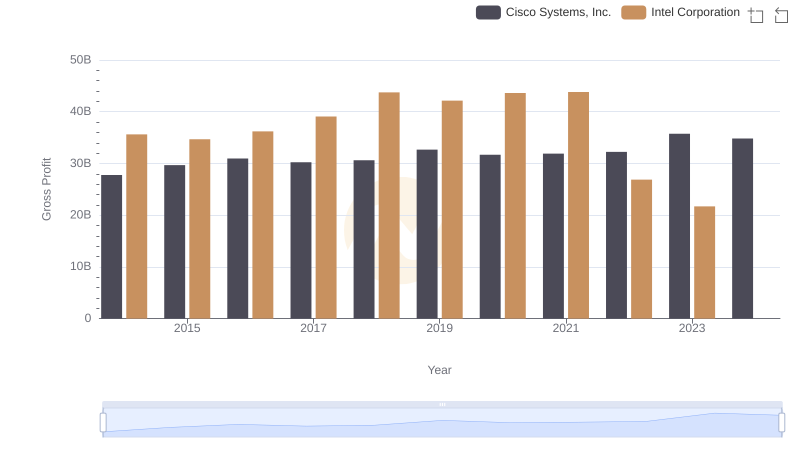
Cisco Systems, Inc. vs Intel Corporation: A Gross Profit Performance Breakdown
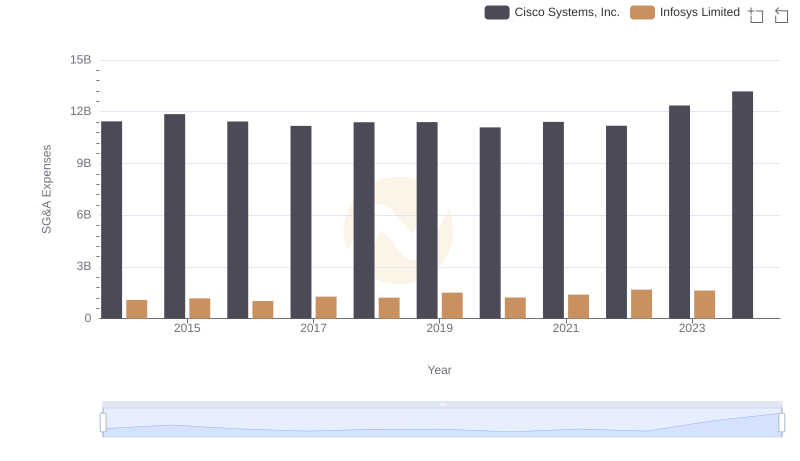
Cisco Systems, Inc. and Infosys Limited: SG&A Spending Patterns Compared
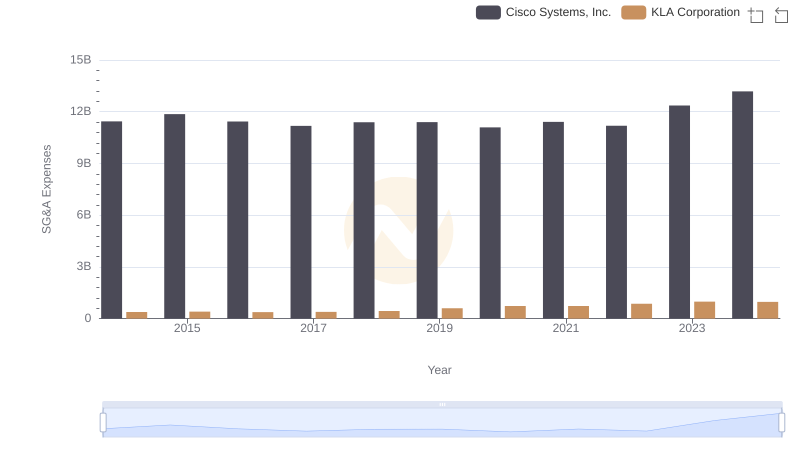
Who Optimizes SG&A Costs Better? Cisco Systems, Inc. or KLA Corporation
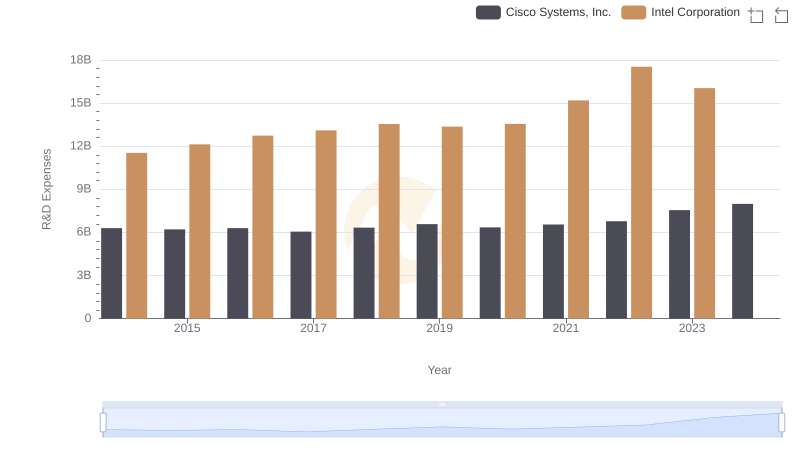
R&D Insights: How Cisco Systems, Inc. and Intel Corporation Allocate Funds
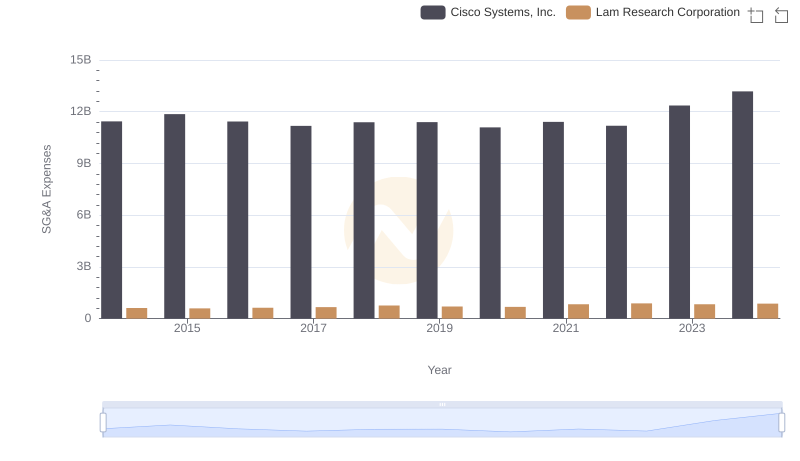
Who Optimizes SG&A Costs Better? Cisco Systems, Inc. or Lam Research Corporation
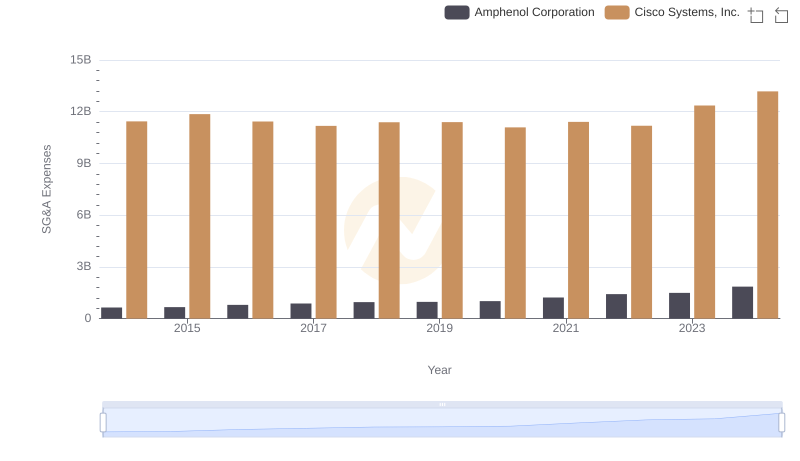
Operational Costs Compared: SG&A Analysis of Cisco Systems, Inc. and Amphenol Corporation
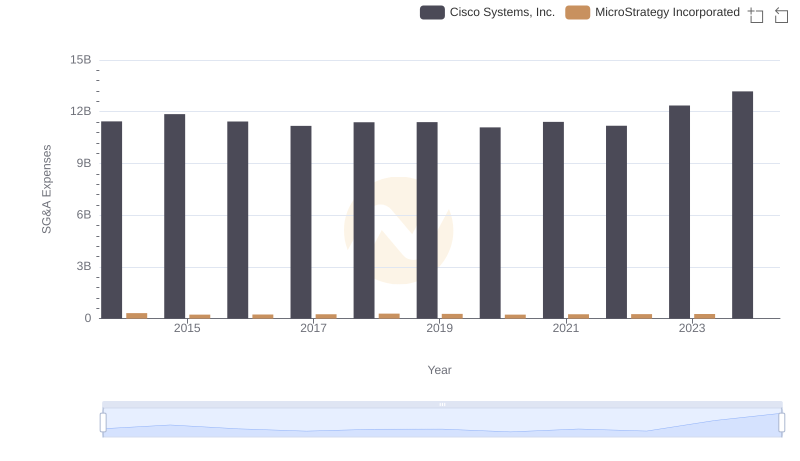
Comparing SG&A Expenses: Cisco Systems, Inc. vs MicroStrategy Incorporated Trends and Insights
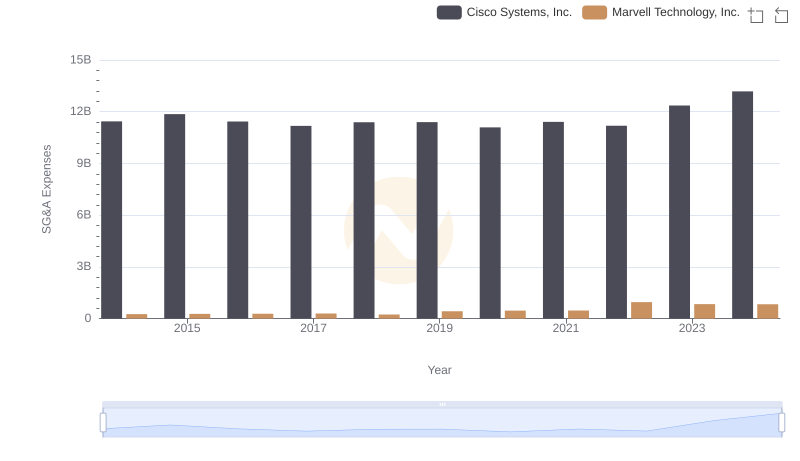
SG&A Efficiency Analysis: Comparing Cisco Systems, Inc. and Marvell Technology, Inc.
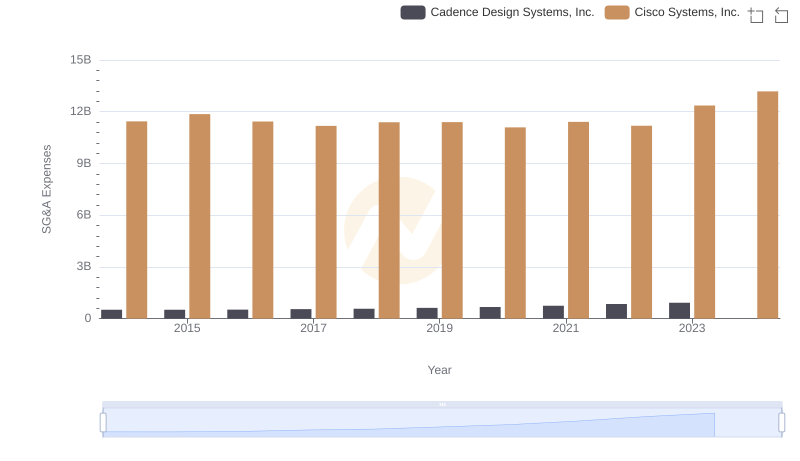
Cisco Systems, Inc. vs Cadence Design Systems, Inc.: SG&A Expense Trends
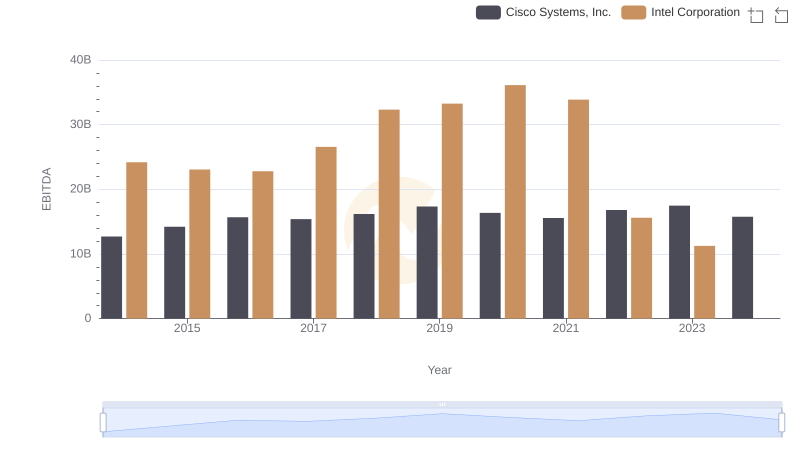
EBITDA Metrics Evaluated: Cisco Systems, Inc. vs Intel Corporation