| __timestamp | Cisco Systems, Inc. | Marvell Technology, Inc. |
|---|---|---|
| Wednesday, January 1, 2014 | 47142000000 | 3404400000 |
| Thursday, January 1, 2015 | 49161000000 | 3706963000 |
| Friday, January 1, 2016 | 49247000000 | 2725828000 |
| Sunday, January 1, 2017 | 48005000000 | 2317674000 |
| Monday, January 1, 2018 | 49330000000 | 2409170000 |
| Tuesday, January 1, 2019 | 51904000000 | 2865791000 |
| Wednesday, January 1, 2020 | 49301000000 | 2699161000 |
| Friday, January 1, 2021 | 49818000000 | 2968900000 |
| Saturday, January 1, 2022 | 51557000000 | 4462383000 |
| Sunday, January 1, 2023 | 56998000000 | 5919600000 |
| Monday, January 1, 2024 | 53803000000 | 5507700000 |
Igniting the spark of knowledge
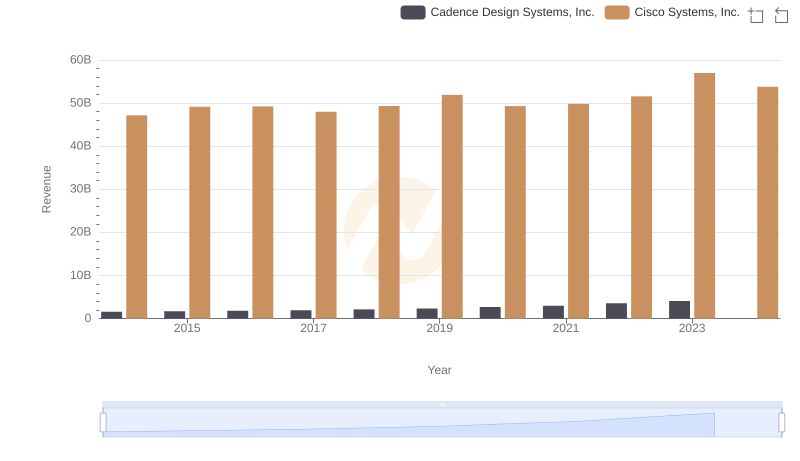
In the ever-evolving tech industry, Cisco Systems, Inc. and Marvell Technology, Inc. have showcased intriguing revenue trajectories over the past decade. From 2014 to 2024, Cisco's revenue has seen a steady climb, peaking in 2023 with a 21% increase from its 2014 figures. Meanwhile, Marvell's revenue journey has been more volatile, yet it achieved a remarkable 74% growth over the same period, highlighting its dynamic market adaptation.
Cisco's revenue growth reflects its robust market presence and strategic expansions. Despite minor fluctuations, the company maintained a consistent upward trend, underscoring its resilience in a competitive landscape.
Marvell, on the other hand, experienced significant growth spurts, particularly post-2021, where its revenue surged by over 50% in just two years. This growth trajectory signals Marvell's successful ventures into emerging tech sectors.
Both companies exemplify different growth strategies, offering valuable insights into the tech industry's diverse landscape.
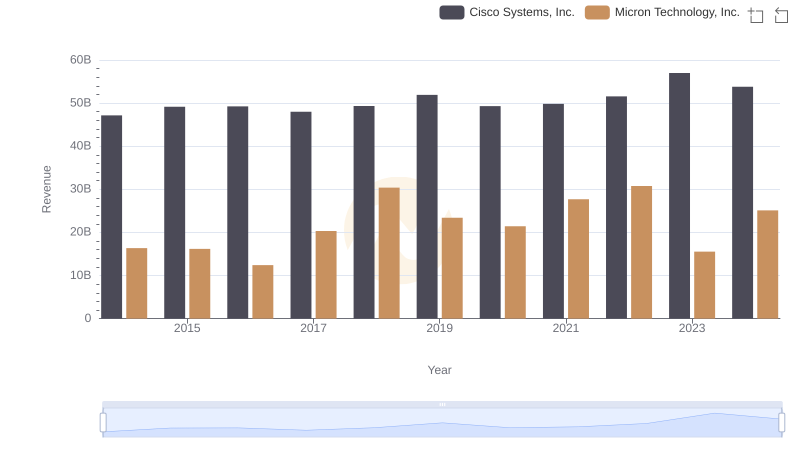
Cisco Systems, Inc. or Micron Technology, Inc.: Who Leads in Yearly Revenue?
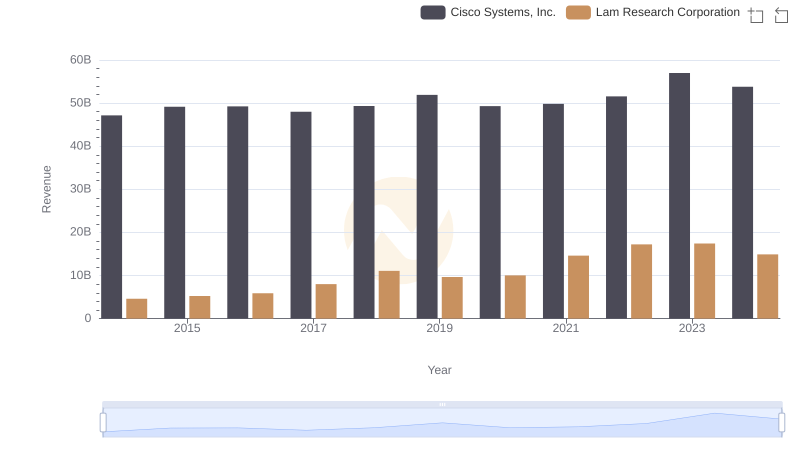
Cisco Systems, Inc. or Lam Research Corporation: Who Leads in Yearly Revenue?
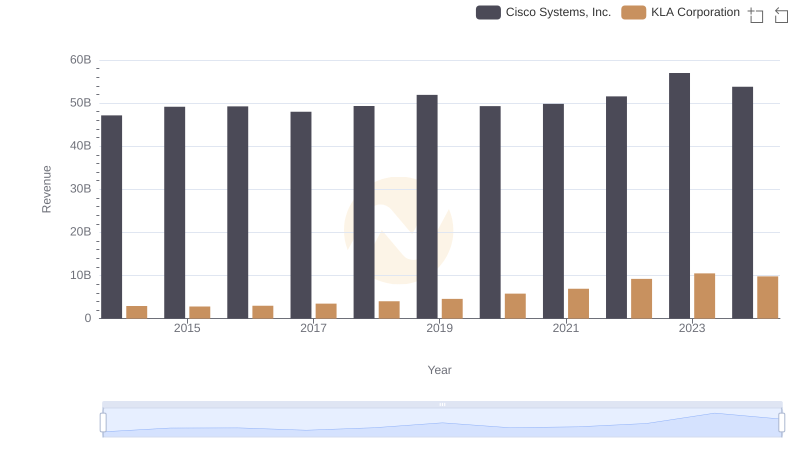
Cisco Systems, Inc. vs KLA Corporation: Annual Revenue Growth Compared
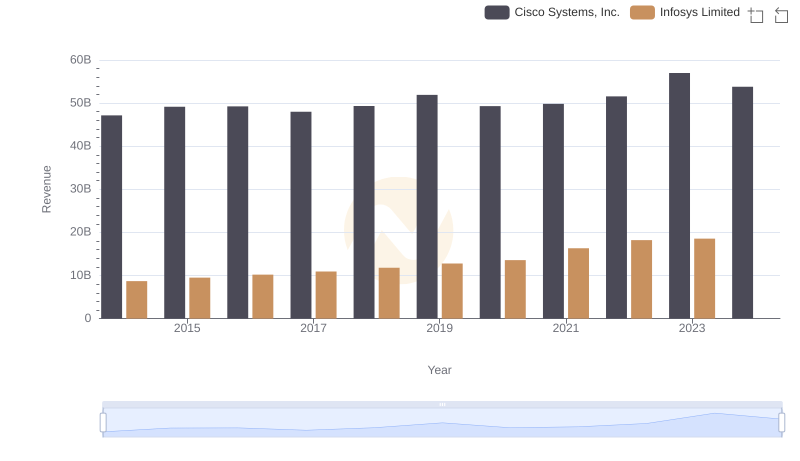
Cisco Systems, Inc. vs Infosys Limited: Annual Revenue Growth Compared
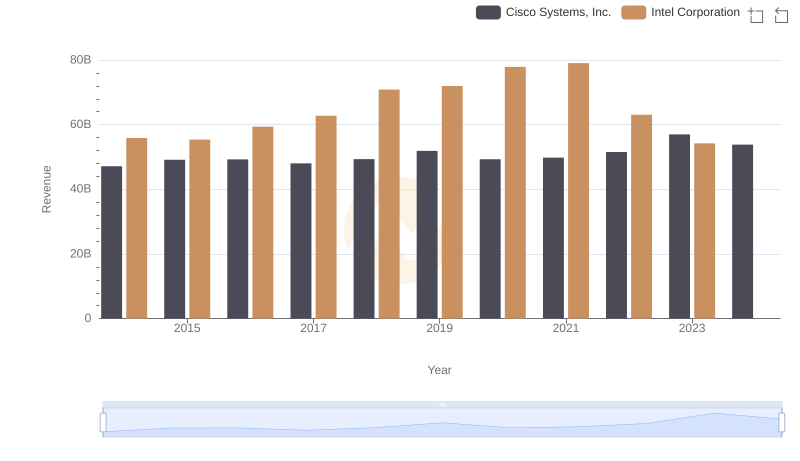
Revenue Showdown: Cisco Systems, Inc. vs Intel Corporation
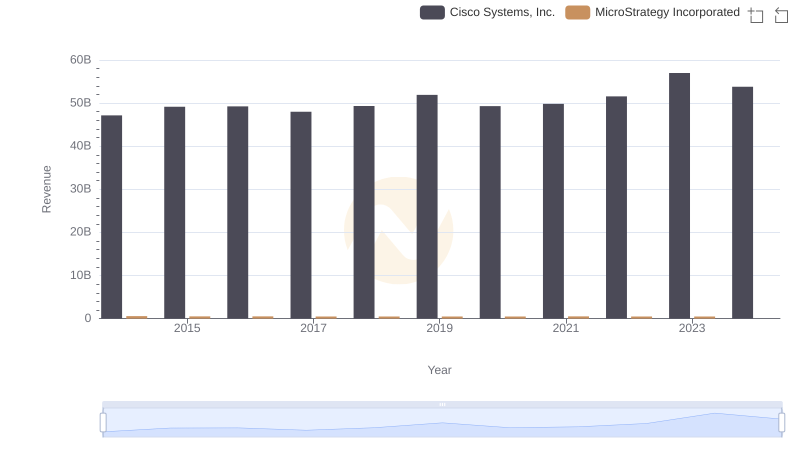
Cisco Systems, Inc. and MicroStrategy Incorporated: A Comprehensive Revenue Analysis
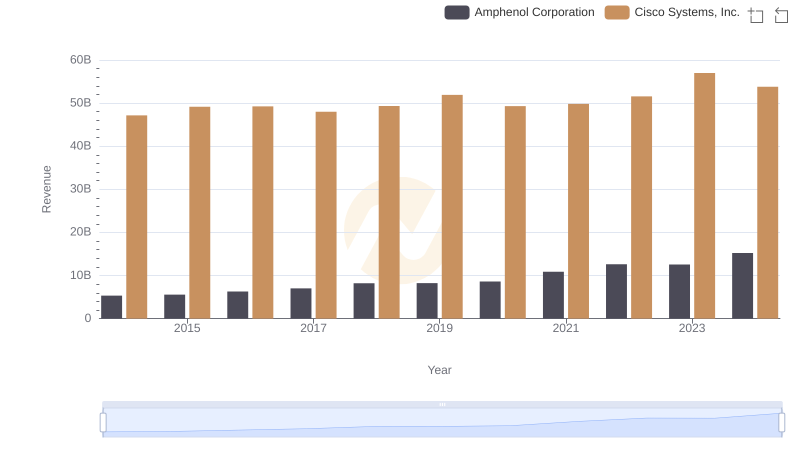
Cisco Systems, Inc. or Amphenol Corporation: Who Leads in Yearly Revenue?
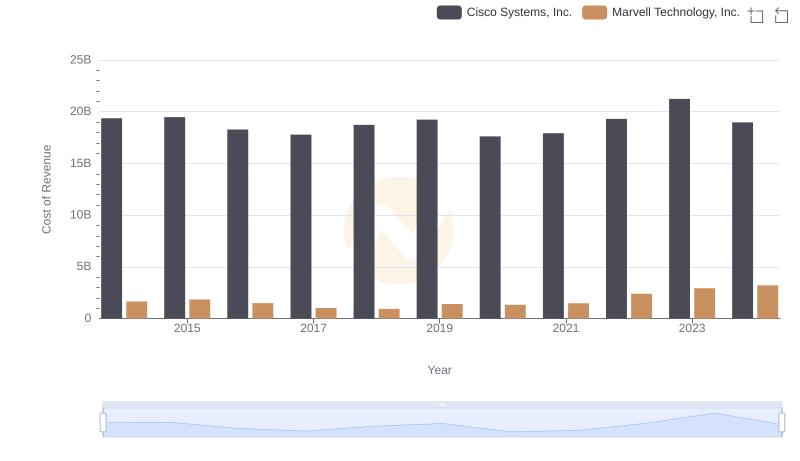
Comparing Cost of Revenue Efficiency: Cisco Systems, Inc. vs Marvell Technology, Inc.
Cisco Systems, Inc. or Cadence Design Systems, Inc.: Who Leads in Yearly Revenue?
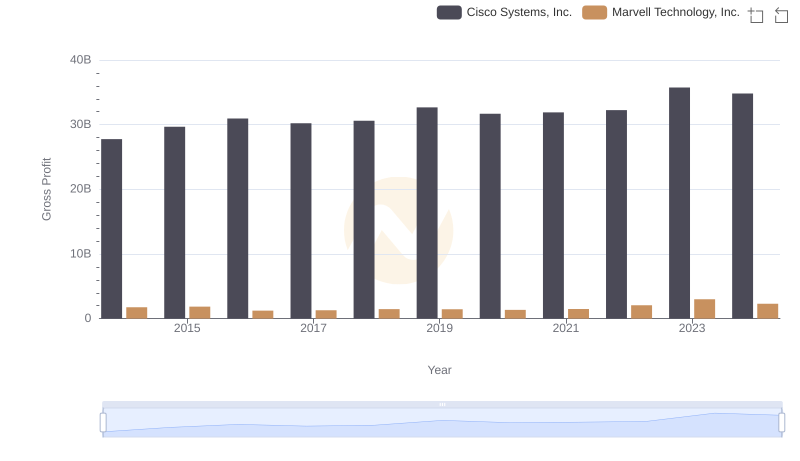
Cisco Systems, Inc. vs Marvell Technology, Inc.: A Gross Profit Performance Breakdown
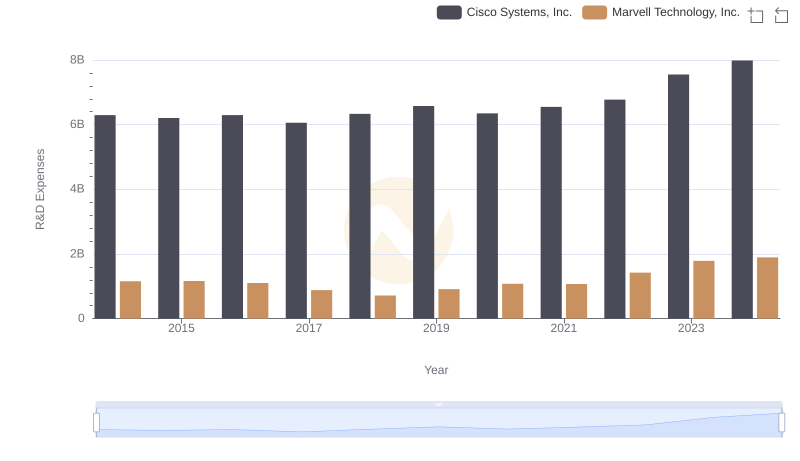
Analyzing R&D Budgets: Cisco Systems, Inc. vs Marvell Technology, Inc.
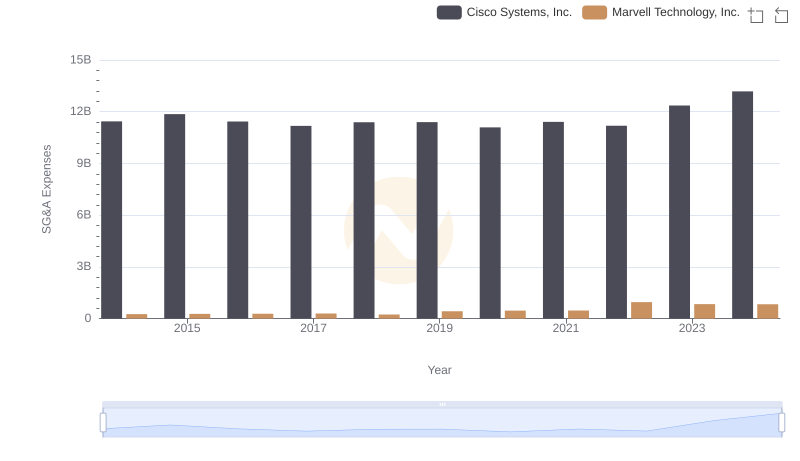
SG&A Efficiency Analysis: Comparing Cisco Systems, Inc. and Marvell Technology, Inc.