| __timestamp | Cadence Design Systems, Inc. | Cisco Systems, Inc. |
|---|---|---|
| Wednesday, January 1, 2014 | 513307000 | 11437000000 |
| Thursday, January 1, 2015 | 512414000 | 11861000000 |
| Friday, January 1, 2016 | 520300000 | 11433000000 |
| Sunday, January 1, 2017 | 553342000 | 11177000000 |
| Monday, January 1, 2018 | 573075000 | 11386000000 |
| Tuesday, January 1, 2019 | 621479000 | 11398000000 |
| Wednesday, January 1, 2020 | 670885000 | 11094000000 |
| Friday, January 1, 2021 | 749280000 | 11411000000 |
| Saturday, January 1, 2022 | 846340000 | 11186000000 |
| Sunday, January 1, 2023 | 920649000 | 12358000000 |
| Monday, January 1, 2024 | 1039766000 | 13177000000 |
Unleashing the power of data
In the ever-evolving tech landscape, understanding financial trends is crucial. This analysis delves into the Selling, General, and Administrative (SG&A) expenses of two industry titans: Cisco Systems, Inc. and Cadence Design Systems, Inc., from 2014 to 2023. Over this period, Cisco's SG&A expenses have shown a steady pattern, peaking in 2023 with a 9% increase from the previous year. Meanwhile, Cadence Design Systems has experienced a remarkable 79% growth in SG&A expenses, reflecting its aggressive expansion strategy. Notably, 2024 data for Cadence is missing, leaving room for speculation on its future trajectory. This financial insight not only highlights the strategic differences between these companies but also underscores the dynamic nature of the tech industry. As these giants continue to innovate, their financial strategies will undoubtedly play a pivotal role in shaping their market positions.
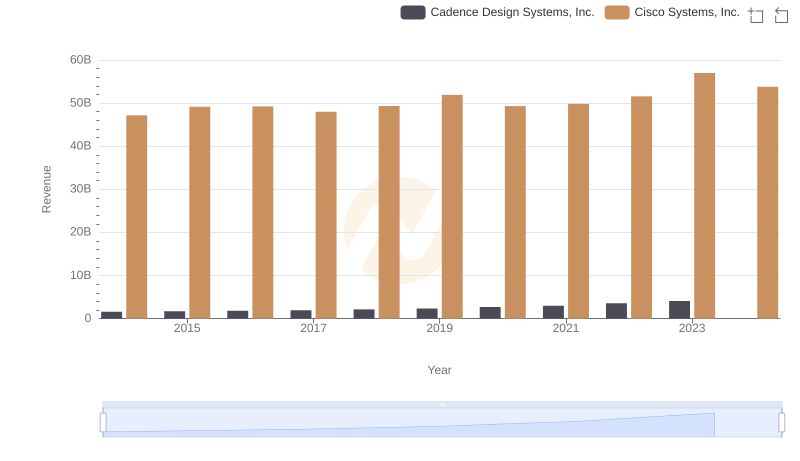
Cisco Systems, Inc. or Cadence Design Systems, Inc.: Who Leads in Yearly Revenue?
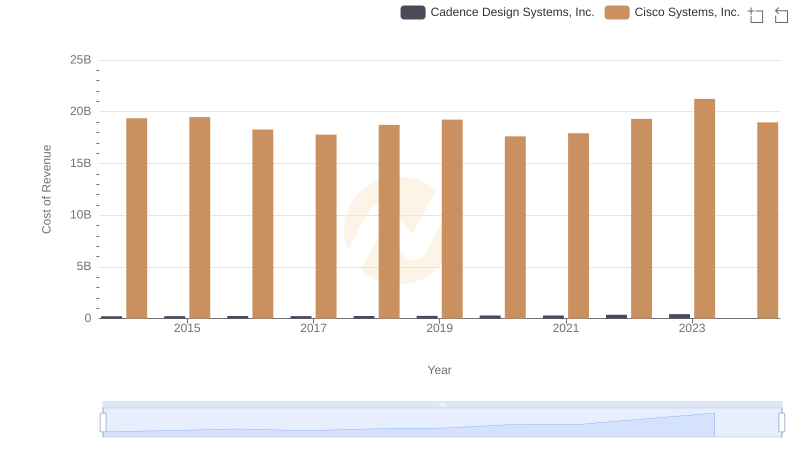
Cost of Revenue: Key Insights for Cisco Systems, Inc. and Cadence Design Systems, Inc.
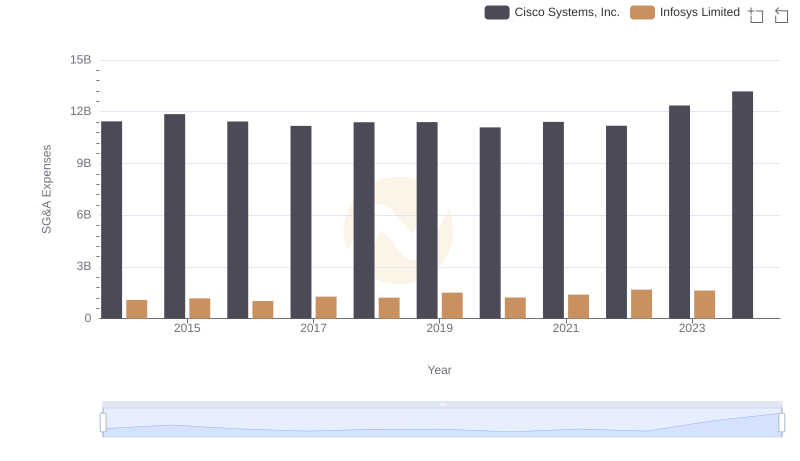
Cisco Systems, Inc. and Infosys Limited: SG&A Spending Patterns Compared
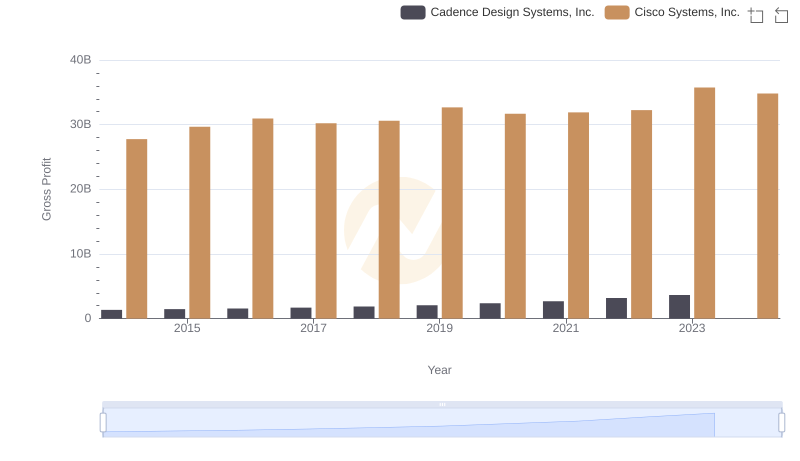
Gross Profit Analysis: Comparing Cisco Systems, Inc. and Cadence Design Systems, Inc.
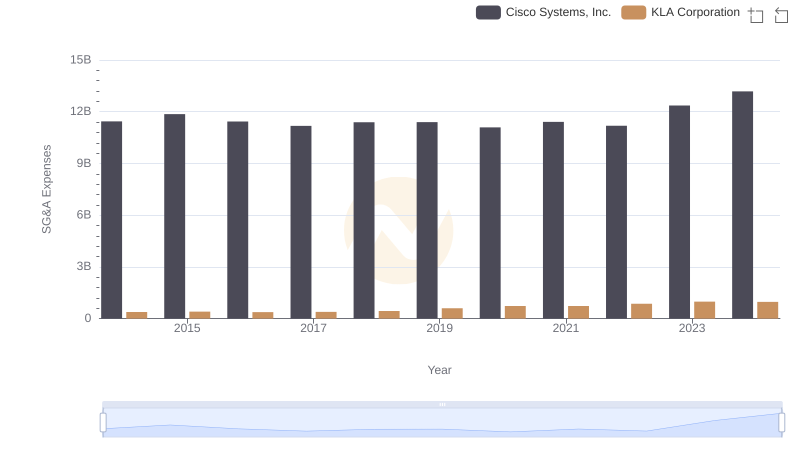
Who Optimizes SG&A Costs Better? Cisco Systems, Inc. or KLA Corporation
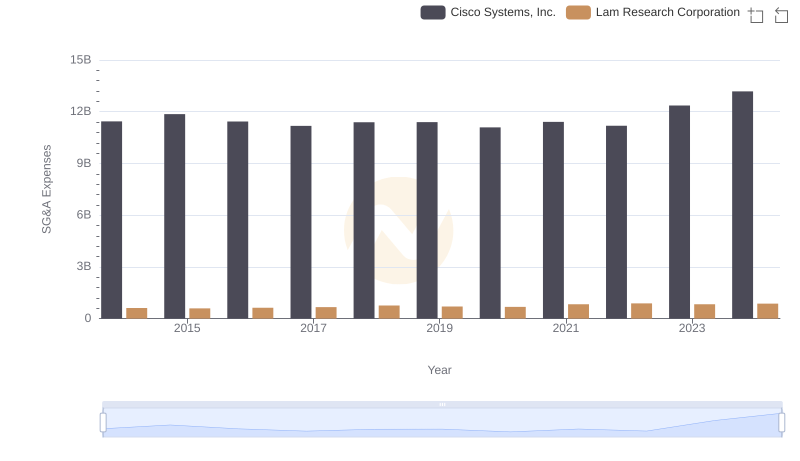
Who Optimizes SG&A Costs Better? Cisco Systems, Inc. or Lam Research Corporation
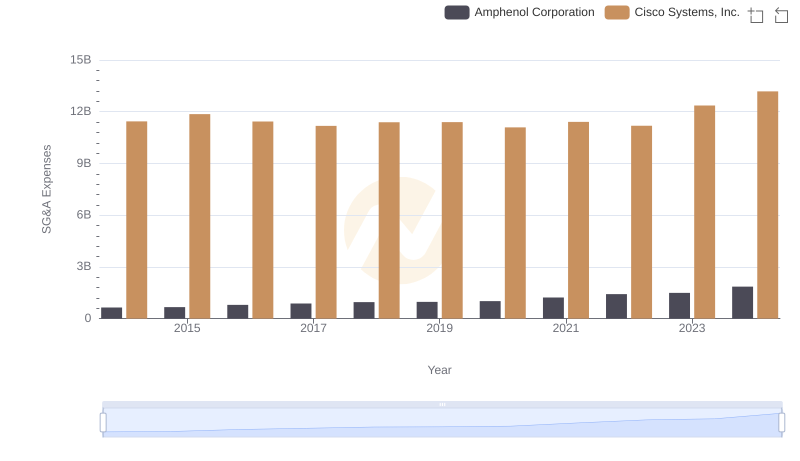
Operational Costs Compared: SG&A Analysis of Cisco Systems, Inc. and Amphenol Corporation

Research and Development Investment: Cisco Systems, Inc. vs Cadence Design Systems, Inc.
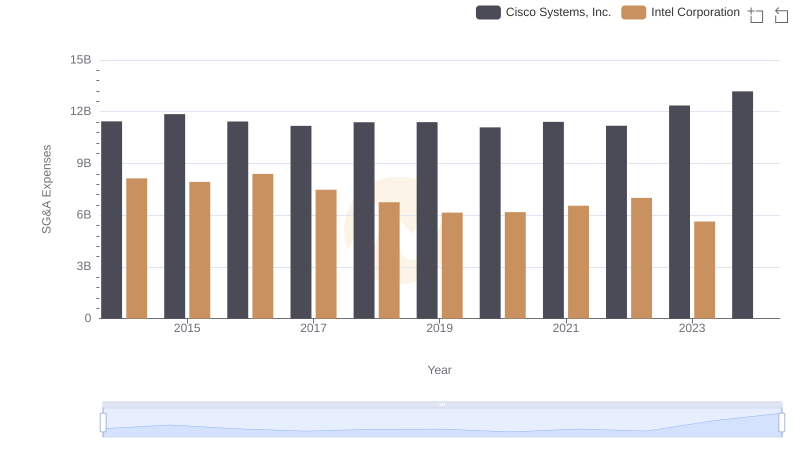
Operational Costs Compared: SG&A Analysis of Cisco Systems, Inc. and Intel Corporation
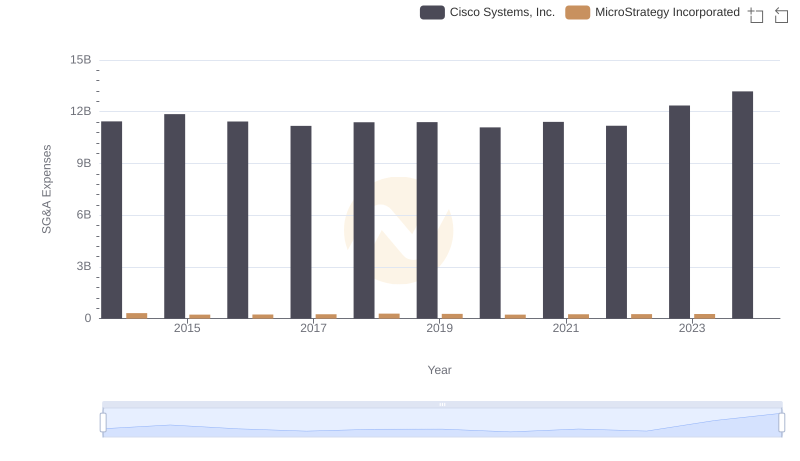
Comparing SG&A Expenses: Cisco Systems, Inc. vs MicroStrategy Incorporated Trends and Insights
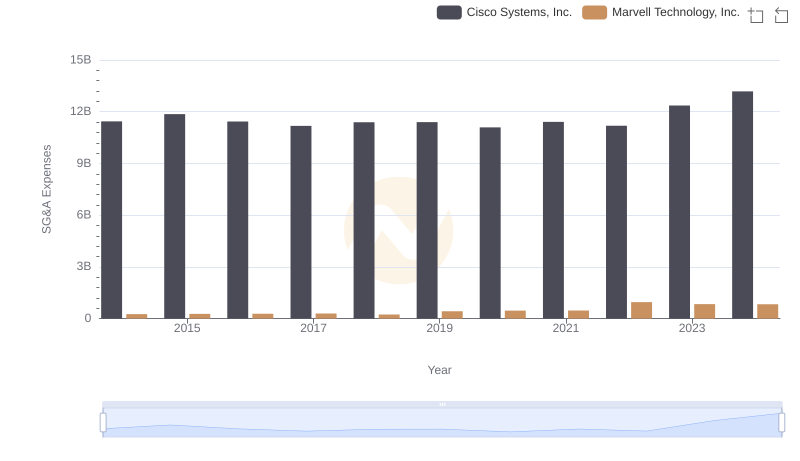
SG&A Efficiency Analysis: Comparing Cisco Systems, Inc. and Marvell Technology, Inc.
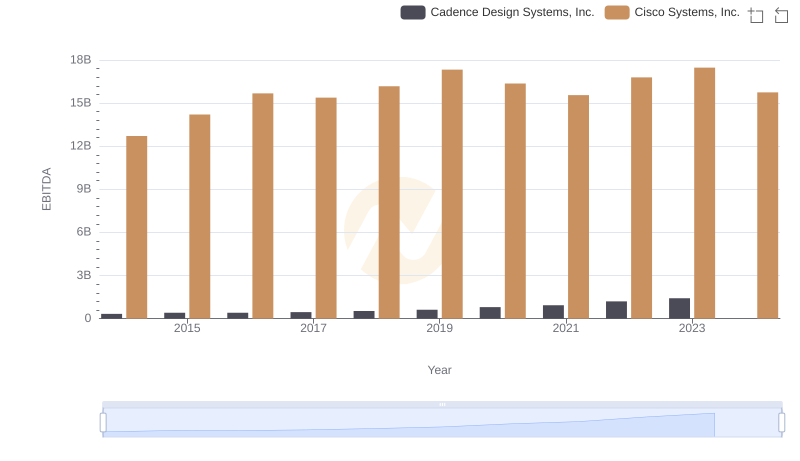
Professional EBITDA Benchmarking: Cisco Systems, Inc. vs Cadence Design Systems, Inc.