| __timestamp | Cisco Systems, Inc. | Fortinet, Inc. |
|---|---|---|
| Wednesday, January 1, 2014 | 11437000000 | 357151000 |
| Thursday, January 1, 2015 | 11861000000 | 541885000 |
| Friday, January 1, 2016 | 11433000000 | 707581000 |
| Sunday, January 1, 2017 | 11177000000 | 788888000 |
| Monday, January 1, 2018 | 11386000000 | 875300000 |
| Tuesday, January 1, 2019 | 11398000000 | 1029000000 |
| Wednesday, January 1, 2020 | 11094000000 | 1191400000 |
| Friday, January 1, 2021 | 11411000000 | 1489200000 |
| Saturday, January 1, 2022 | 11186000000 | 1855100000 |
| Sunday, January 1, 2023 | 12358000000 | 2217300000 |
| Monday, January 1, 2024 | 13177000000 | 2282600000 |
Igniting the spark of knowledge
In the ever-evolving tech landscape, understanding the financial health of industry leaders is crucial. Cisco Systems, Inc. and Fortinet, Inc. have been pivotal players, each with unique strategies reflected in their Selling, General, and Administrative (SG&A) expenses. From 2014 to 2023, Cisco's SG&A costs have shown a steady increase, peaking at approximately $13.2 billion in 2023, a 15% rise from 2014. In contrast, Fortinet's expenses have surged by over 500% during the same period, reaching around $2.2 billion in 2023. This dramatic growth underscores Fortinet's aggressive expansion strategy. However, data for 2024 is incomplete, highlighting the dynamic nature of financial forecasting. As these companies navigate the future, their SG&A trends offer a window into their strategic priorities and market positioning.
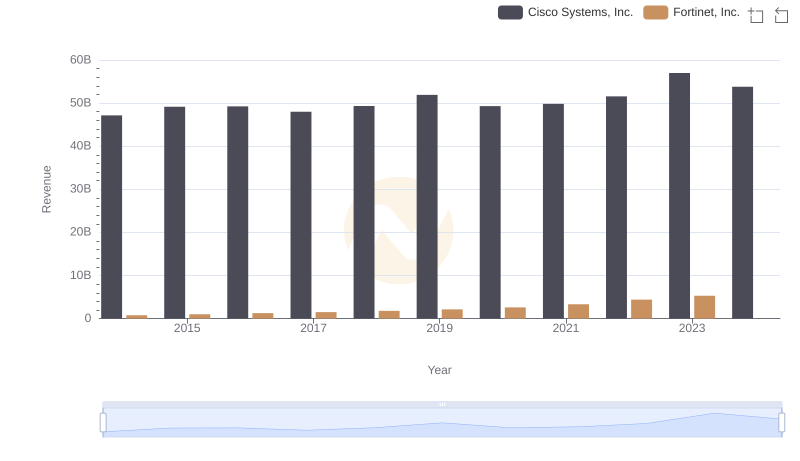
Cisco Systems, Inc. vs Fortinet, Inc.: Annual Revenue Growth Compared
Comparing Cost of Revenue Efficiency: Cisco Systems, Inc. vs Fortinet, Inc.
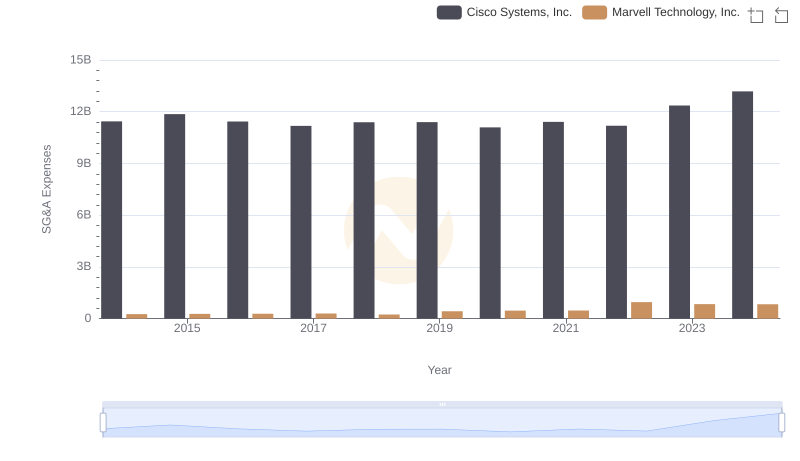
SG&A Efficiency Analysis: Comparing Cisco Systems, Inc. and Marvell Technology, Inc.
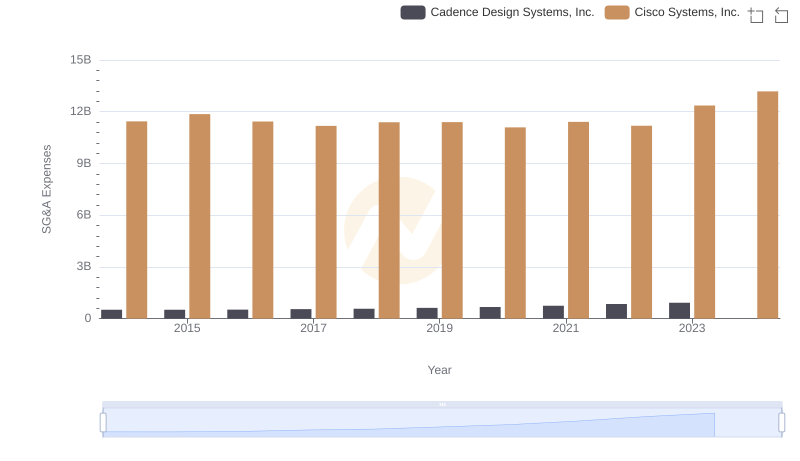
Cisco Systems, Inc. vs Cadence Design Systems, Inc.: SG&A Expense Trends
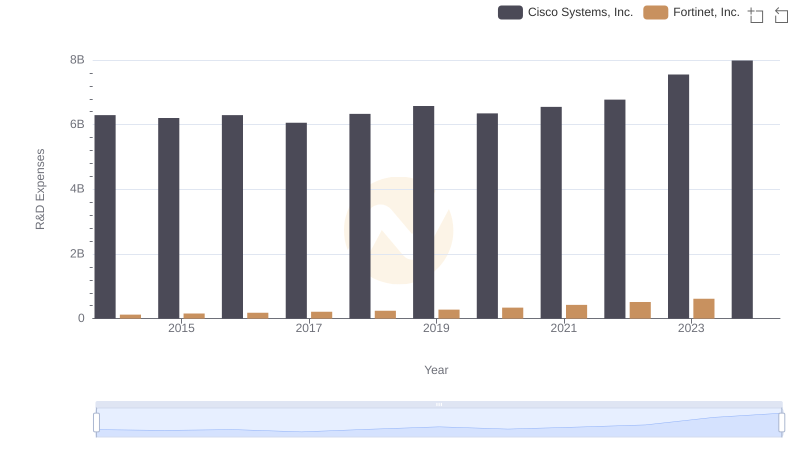
Research and Development Expenses Breakdown: Cisco Systems, Inc. vs Fortinet, Inc.
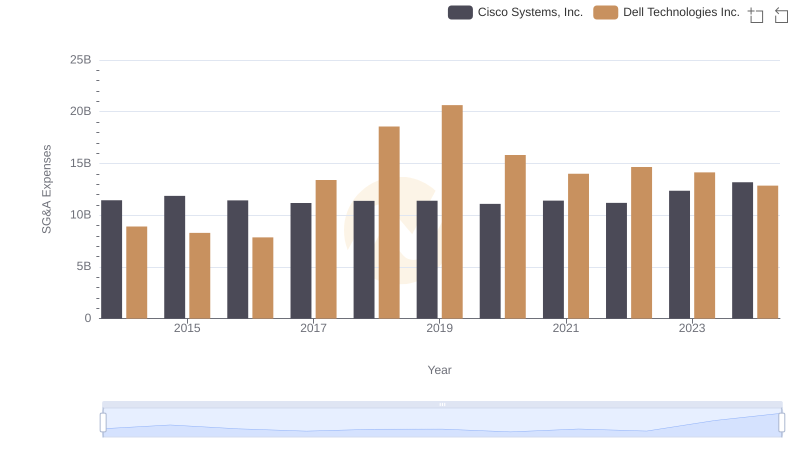
Comparing SG&A Expenses: Cisco Systems, Inc. vs Dell Technologies Inc. Trends and Insights
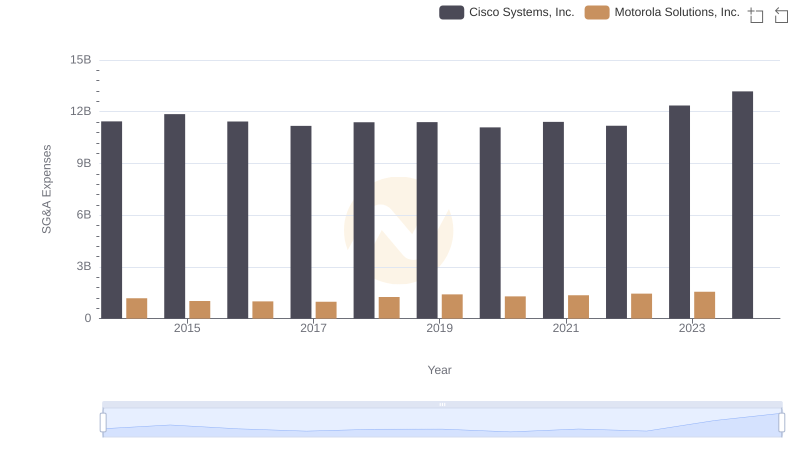
Cisco Systems, Inc. or Motorola Solutions, Inc.: Who Manages SG&A Costs Better?
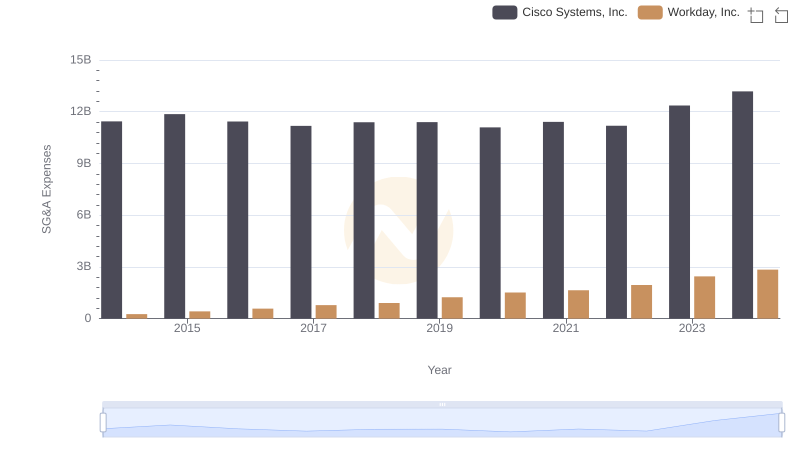
Comparing SG&A Expenses: Cisco Systems, Inc. vs Workday, Inc. Trends and Insights
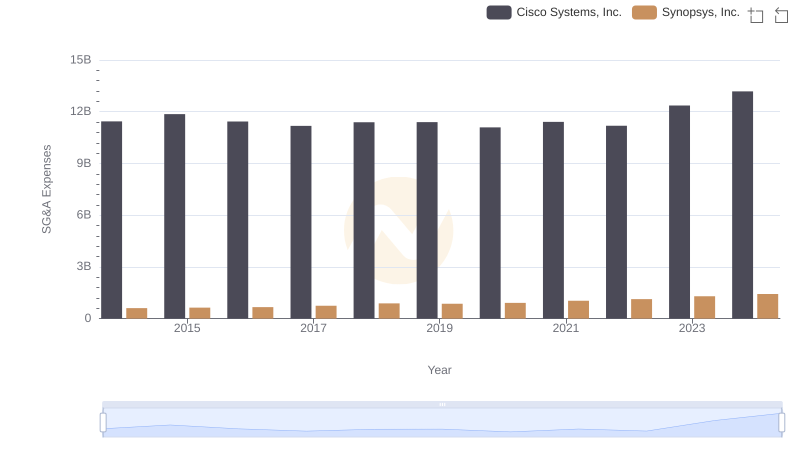
Who Optimizes SG&A Costs Better? Cisco Systems, Inc. or Synopsys, Inc.
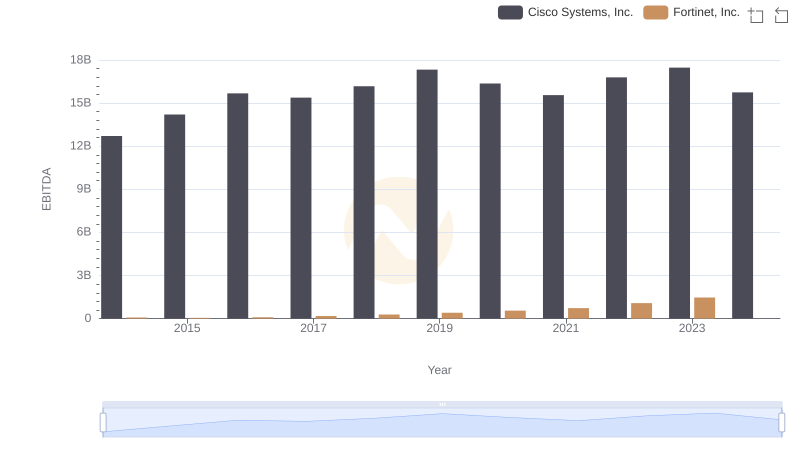
EBITDA Metrics Evaluated: Cisco Systems, Inc. vs Fortinet, Inc.
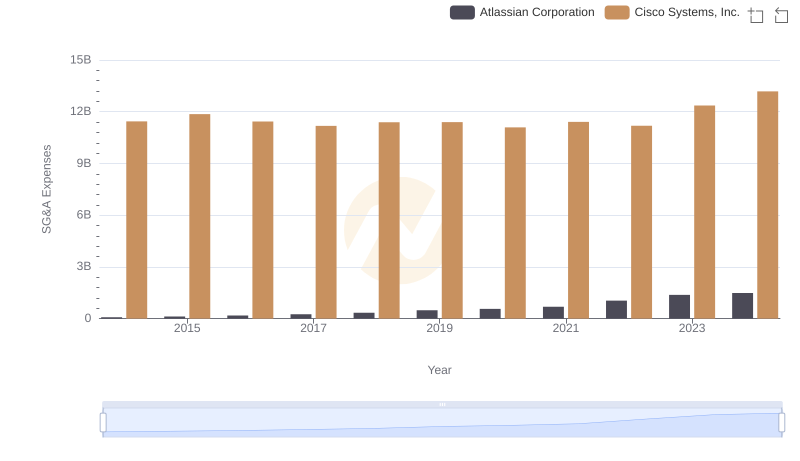
Comparing SG&A Expenses: Cisco Systems, Inc. vs Atlassian Corporation Trends and Insights