| __timestamp | Amphenol Corporation | Cisco Systems, Inc. |
|---|---|---|
| Wednesday, January 1, 2014 | 645100000 | 11437000000 |
| Thursday, January 1, 2015 | 669100000 | 11861000000 |
| Friday, January 1, 2016 | 798200000 | 11433000000 |
| Sunday, January 1, 2017 | 878300000 | 11177000000 |
| Monday, January 1, 2018 | 959500000 | 11386000000 |
| Tuesday, January 1, 2019 | 971400000 | 11398000000 |
| Wednesday, January 1, 2020 | 1014200000 | 11094000000 |
| Friday, January 1, 2021 | 1226300000 | 11411000000 |
| Saturday, January 1, 2022 | 1420900000 | 11186000000 |
| Sunday, January 1, 2023 | 1489900000 | 12358000000 |
| Monday, January 1, 2024 | 1855400000 | 13177000000 |
Unveiling the hidden dimensions of data
In the ever-evolving landscape of technology and electronics, operational efficiency is paramount. This analysis delves into the Selling, General, and Administrative (SG&A) expenses of two industry giants: Cisco Systems, Inc. and Amphenol Corporation, from 2014 to 2024. Over this decade, Cisco's SG&A expenses have consistently dwarfed those of Amphenol, averaging nearly 10 times higher. However, Amphenol has shown a remarkable upward trend, with a 187% increase in SG&A expenses, reflecting its aggressive growth strategy.
This data underscores the strategic differences between a tech behemoth and a rapidly growing electronics manufacturer, offering valuable insights for investors and industry analysts.
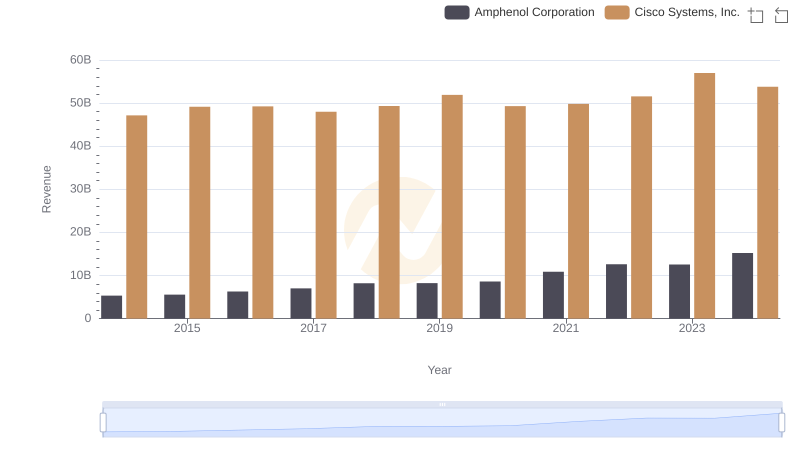
Cisco Systems, Inc. or Amphenol Corporation: Who Leads in Yearly Revenue?
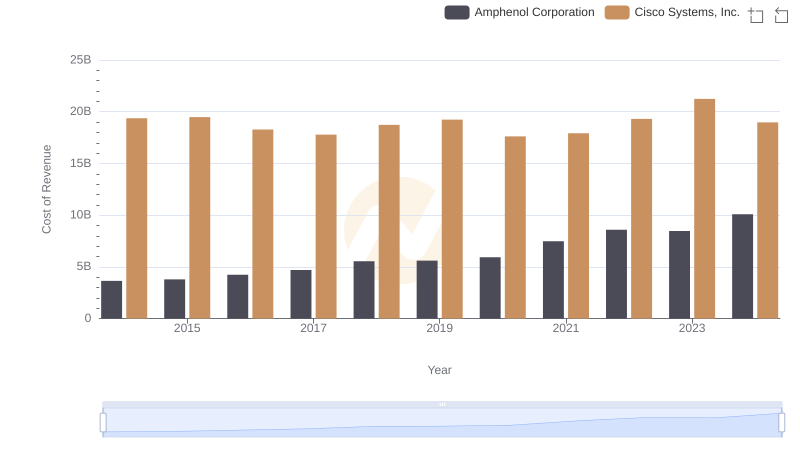
Cost of Revenue Trends: Cisco Systems, Inc. vs Amphenol Corporation
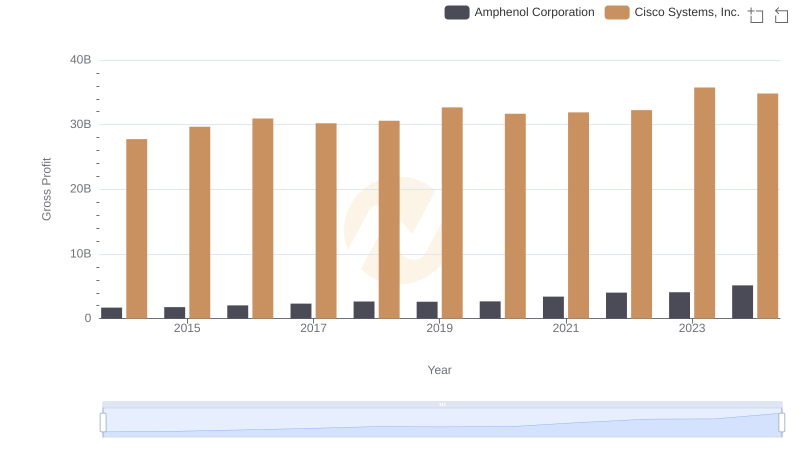
Key Insights on Gross Profit: Cisco Systems, Inc. vs Amphenol Corporation
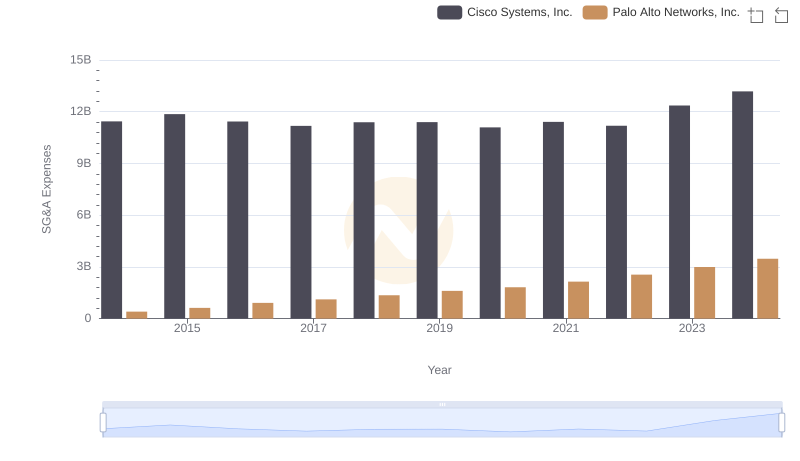
Cisco Systems, Inc. and Palo Alto Networks, Inc.: SG&A Spending Patterns Compared
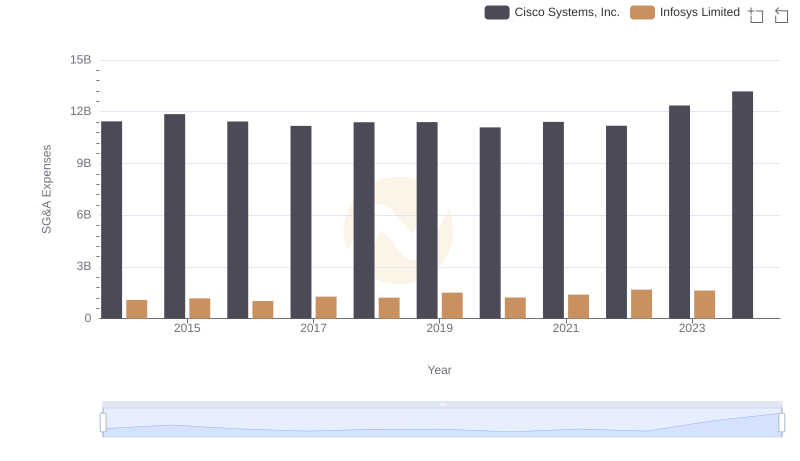
Cisco Systems, Inc. and Infosys Limited: SG&A Spending Patterns Compared
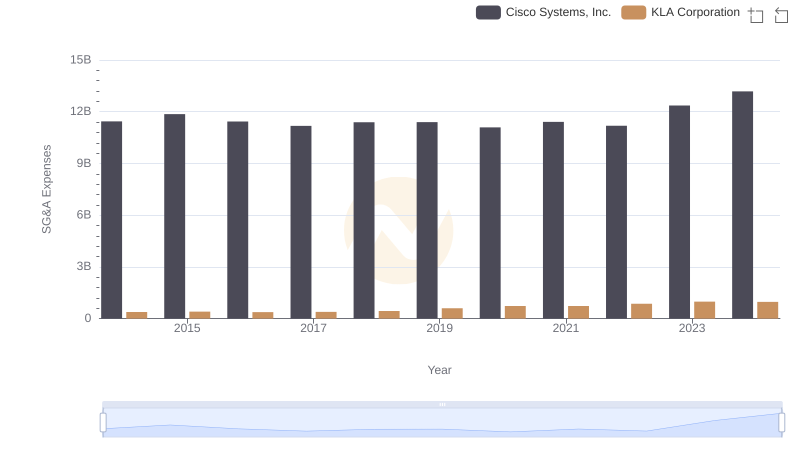
Who Optimizes SG&A Costs Better? Cisco Systems, Inc. or KLA Corporation
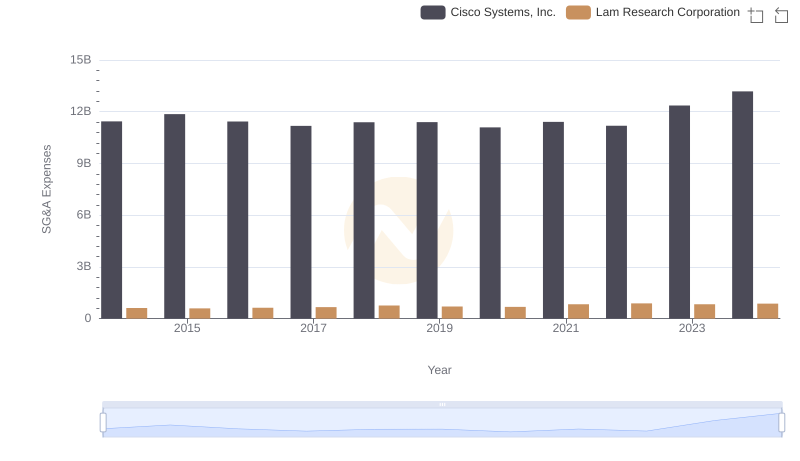
Who Optimizes SG&A Costs Better? Cisco Systems, Inc. or Lam Research Corporation
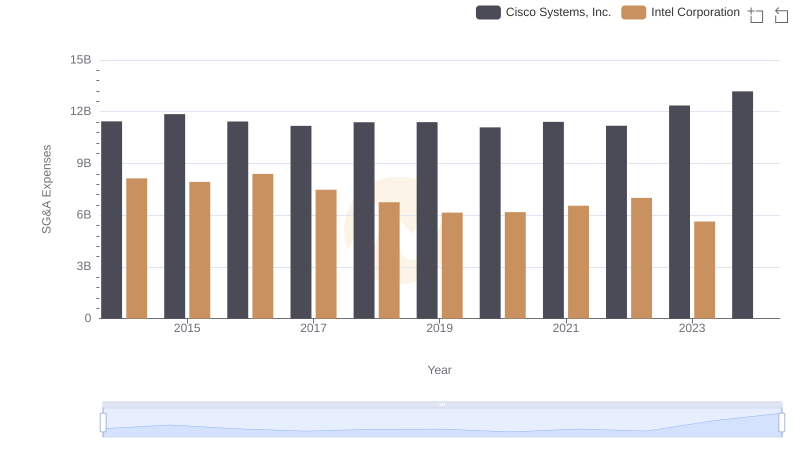
Operational Costs Compared: SG&A Analysis of Cisco Systems, Inc. and Intel Corporation
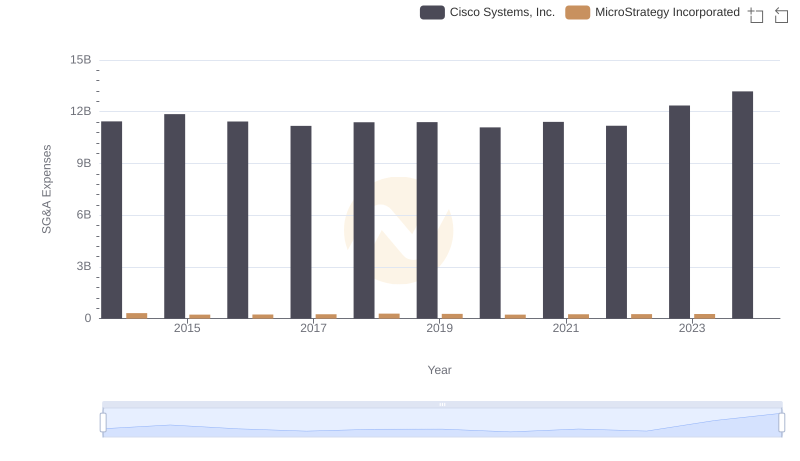
Comparing SG&A Expenses: Cisco Systems, Inc. vs MicroStrategy Incorporated Trends and Insights
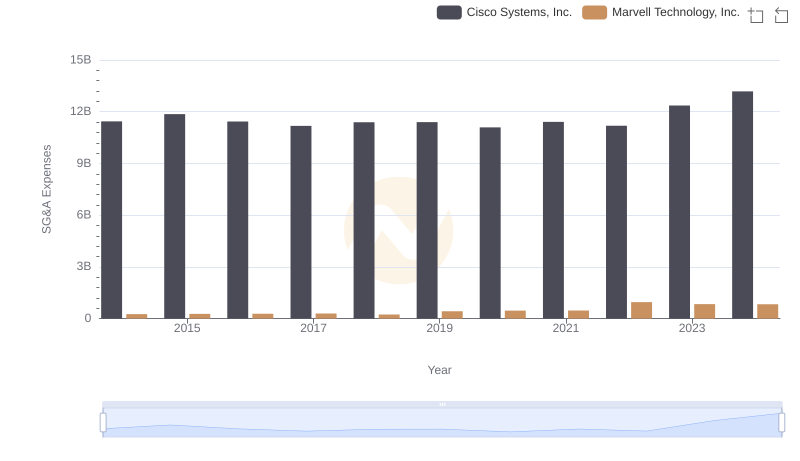
SG&A Efficiency Analysis: Comparing Cisco Systems, Inc. and Marvell Technology, Inc.
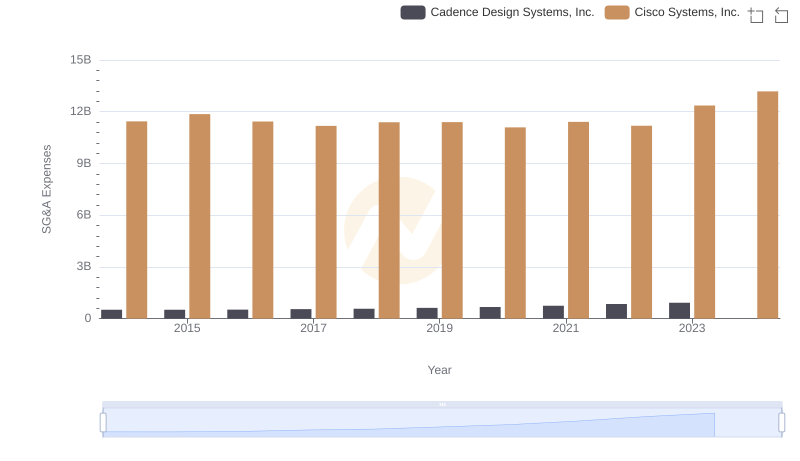
Cisco Systems, Inc. vs Cadence Design Systems, Inc.: SG&A Expense Trends
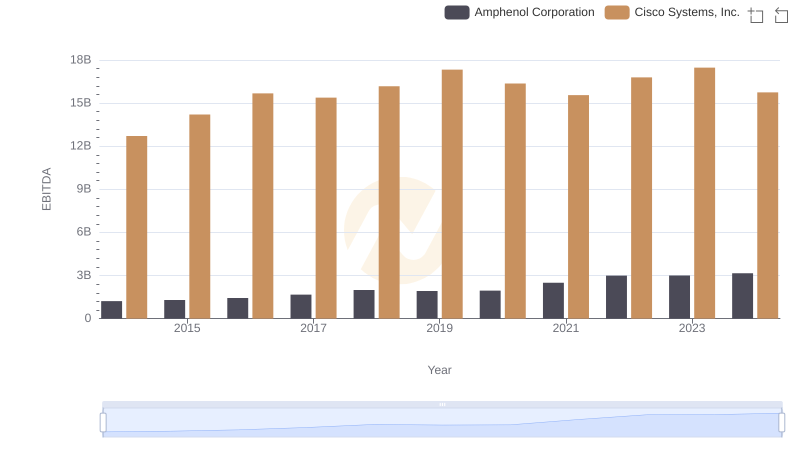
Comprehensive EBITDA Comparison: Cisco Systems, Inc. vs Amphenol Corporation