| __timestamp | Infosys Limited | The Trade Desk, Inc. |
|---|---|---|
| Wednesday, January 1, 2014 | 1079000000 | 23975000 |
| Thursday, January 1, 2015 | 1176000000 | 40070000 |
| Friday, January 1, 2016 | 1020000000 | 78219000 |
| Sunday, January 1, 2017 | 1279000000 | 119825000 |
| Monday, January 1, 2018 | 1220000000 | 171981000 |
| Tuesday, January 1, 2019 | 1504000000 | 275930000 |
| Wednesday, January 1, 2020 | 1223000000 | 346359000 |
| Friday, January 1, 2021 | 1391000000 | 623959000 |
| Saturday, January 1, 2022 | 1678000000 | 863142000 |
| Sunday, January 1, 2023 | 1632000000 | 968248000 |
| Monday, January 1, 2024 | 1082333000 |
Unveiling the hidden dimensions of data
In the ever-evolving landscape of global business, understanding the financial strategies of leading companies is crucial. This chart provides a fascinating glimpse into the Selling, General, and Administrative (SG&A) expenses of two industry giants: Infosys Limited and The Trade Desk, Inc., from 2014 to 2023.
Infosys, a stalwart in the IT services sector, has consistently maintained higher SG&A expenses compared to The Trade Desk, a rising star in digital advertising. Over the decade, Infosys's SG&A costs have grown by approximately 51%, peaking in 2022. Meanwhile, The Trade Desk has seen a staggering increase of over 3,900% in its SG&A expenses, reflecting its rapid expansion and aggressive market strategies.
This comparison not only highlights the contrasting growth trajectories of these companies but also underscores the diverse approaches to managing operational costs in different industries.
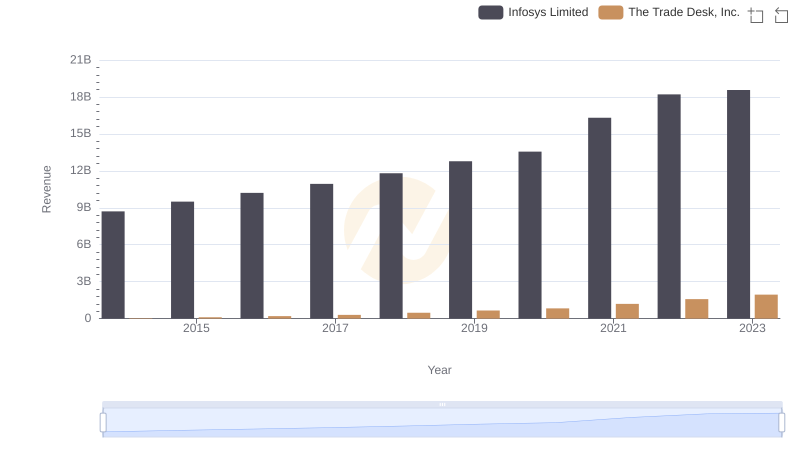
Annual Revenue Comparison: Infosys Limited vs The Trade Desk, Inc.
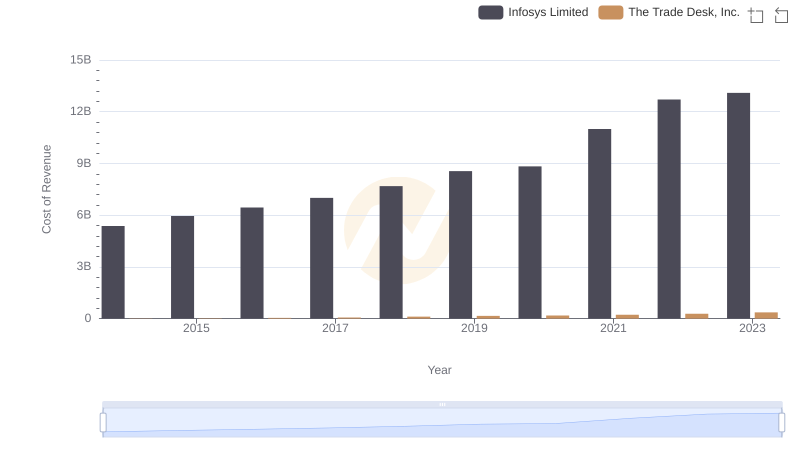
Cost of Revenue: Key Insights for Infosys Limited and The Trade Desk, Inc.
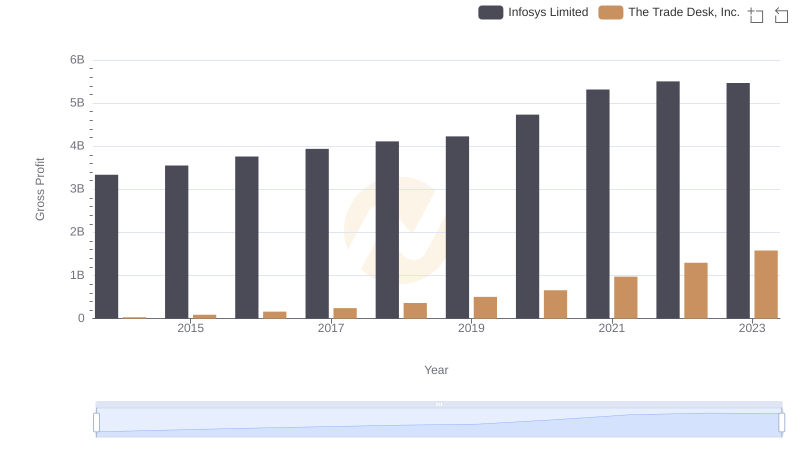
Key Insights on Gross Profit: Infosys Limited vs The Trade Desk, Inc.
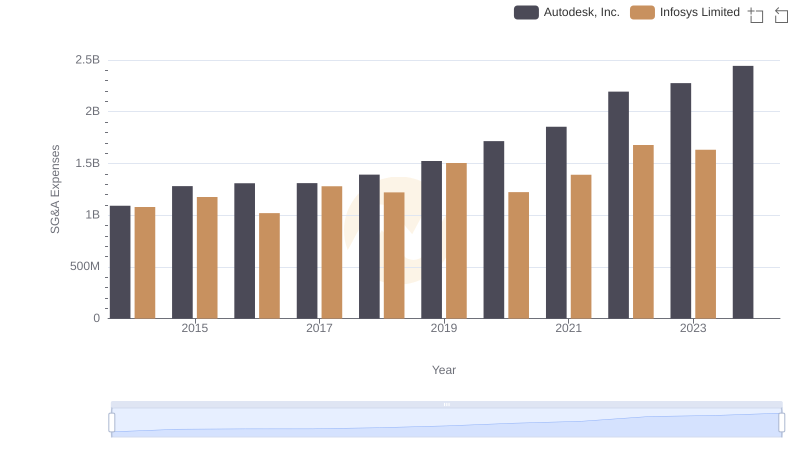
Infosys Limited and Autodesk, Inc.: SG&A Spending Patterns Compared
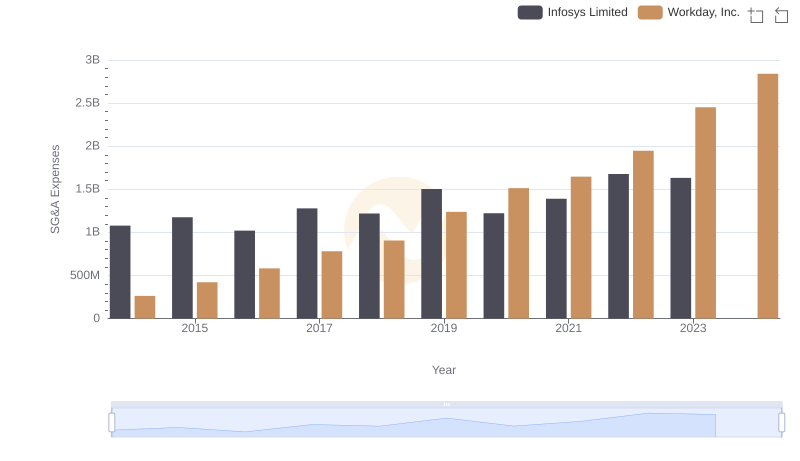
Operational Costs Compared: SG&A Analysis of Infosys Limited and Workday, Inc.
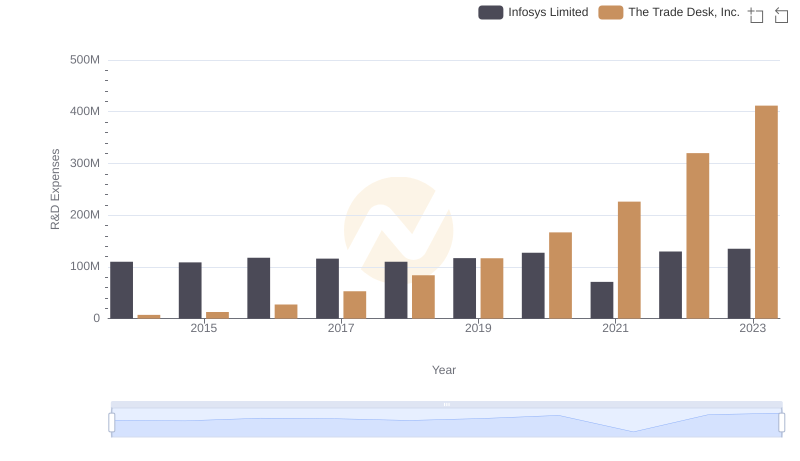
Research and Development Investment: Infosys Limited vs The Trade Desk, Inc.
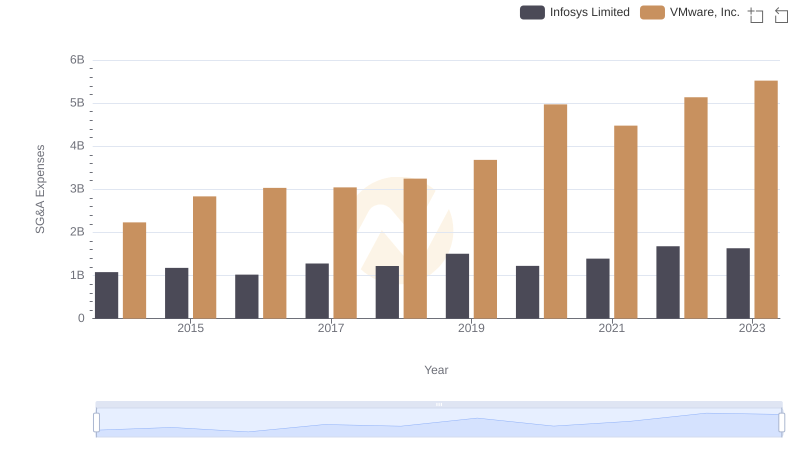
SG&A Efficiency Analysis: Comparing Infosys Limited and VMware, Inc.
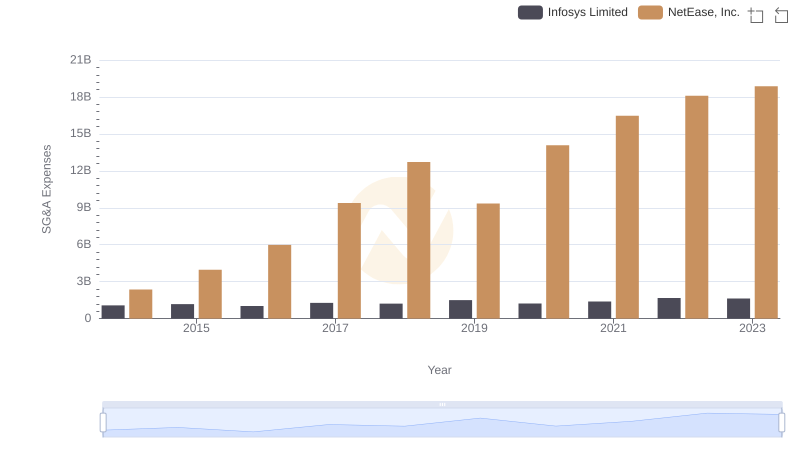
Cost Management Insights: SG&A Expenses for Infosys Limited and NetEase, Inc.
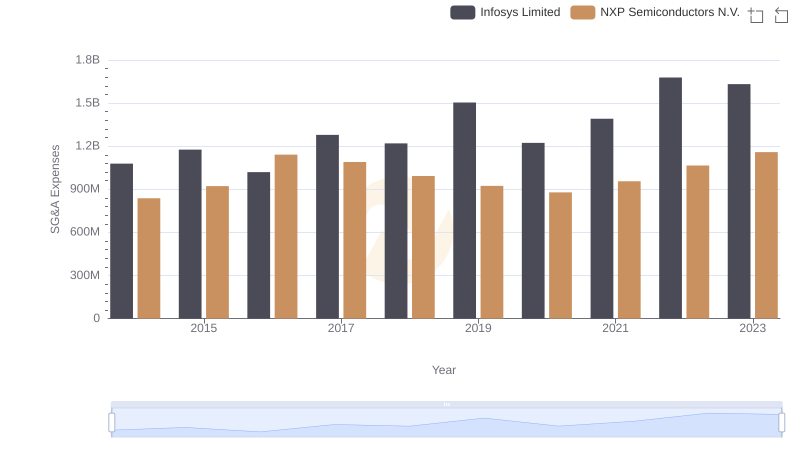
SG&A Efficiency Analysis: Comparing Infosys Limited and NXP Semiconductors N.V.
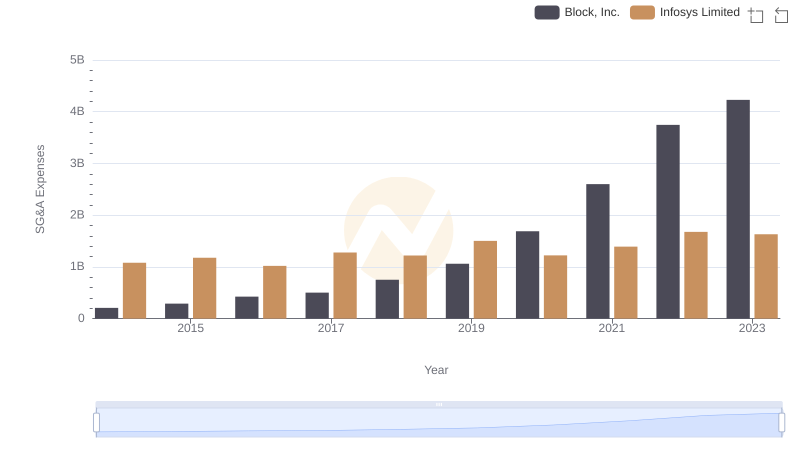
Infosys Limited vs Block, Inc.: SG&A Expense Trends
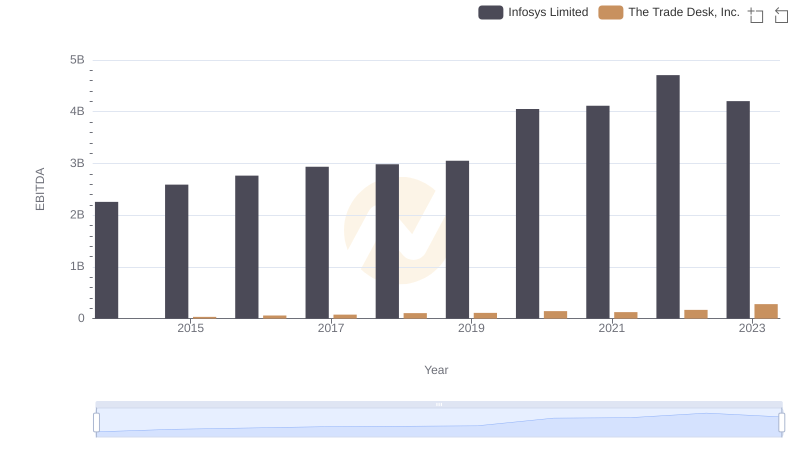
Infosys Limited and The Trade Desk, Inc.: A Detailed Examination of EBITDA Performance
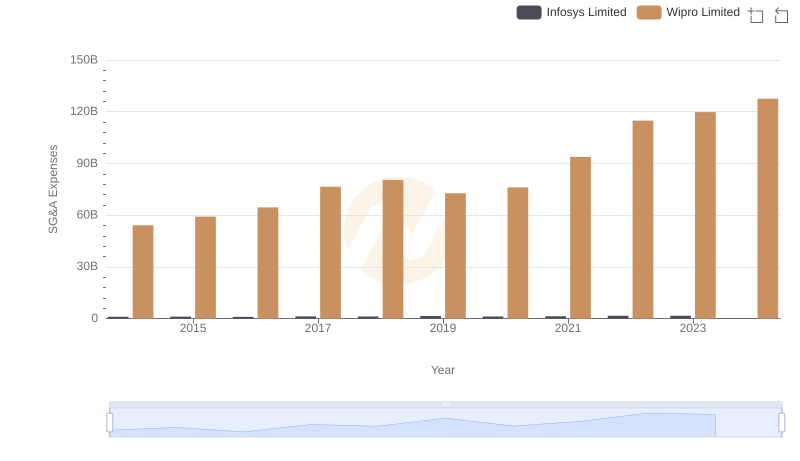
Cost Management Insights: SG&A Expenses for Infosys Limited and Wipro Limited