| __timestamp | Infosys Limited | The Trade Desk, Inc. |
|---|---|---|
| Wednesday, January 1, 2014 | 8711000000 | 44548000 |
| Thursday, January 1, 2015 | 9501000000 | 113836000 |
| Friday, January 1, 2016 | 10208000000 | 202926000 |
| Sunday, January 1, 2017 | 10939000000 | 308217000 |
| Monday, January 1, 2018 | 11799000000 | 477294000 |
| Tuesday, January 1, 2019 | 12780000000 | 661058000 |
| Wednesday, January 1, 2020 | 13561000000 | 836033000 |
| Friday, January 1, 2021 | 16311000000 | 1196467000 |
| Saturday, January 1, 2022 | 18212000000 | 1577795000 |
| Sunday, January 1, 2023 | 18562000000 | 1946120000 |
| Monday, January 1, 2024 | 2444831000 |
Unleashing the power of data
In the ever-evolving landscape of global business, the revenue trajectories of Infosys Limited and The Trade Desk, Inc. offer a fascinating study in contrasts. Over the past decade, Infosys, a titan in the IT services sector, has seen its annual revenue grow by approximately 113%, from $8.7 billion in 2014 to $18.6 billion in 2023. This steady growth underscores its robust position in the industry.
Meanwhile, The Trade Desk, a leader in digital advertising technology, has experienced a meteoric rise. Its revenue surged by an astounding 4,270%, from a modest $44.5 million in 2014 to nearly $1.95 billion in 2023. This remarkable growth highlights the increasing importance of digital advertising in the modern economy.
These trends not only reflect the companies' strategic prowess but also the broader shifts in their respective industries, making them compelling case studies for investors and analysts alike.
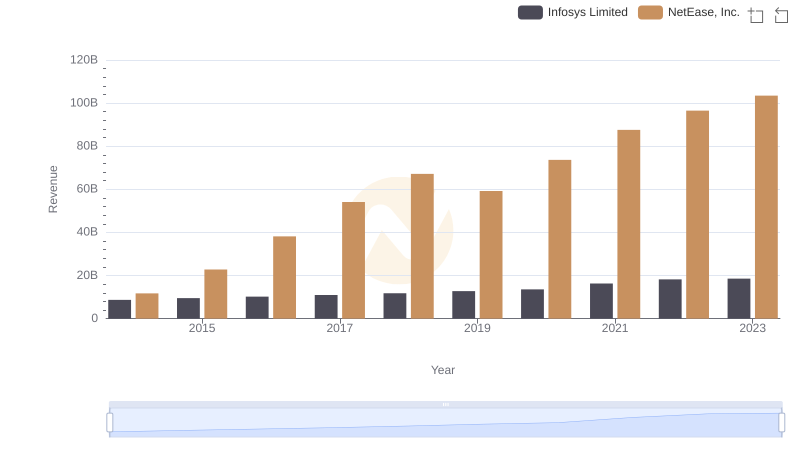
Infosys Limited vs NetEase, Inc.: Examining Key Revenue Metrics
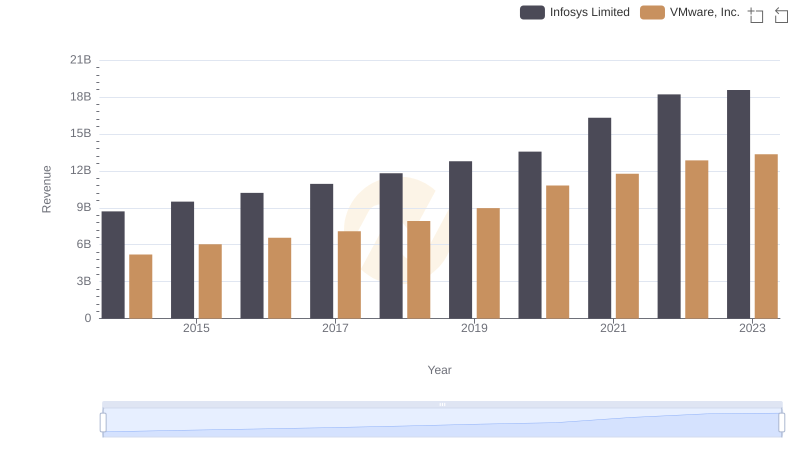
Who Generates More Revenue? Infosys Limited or VMware, Inc.
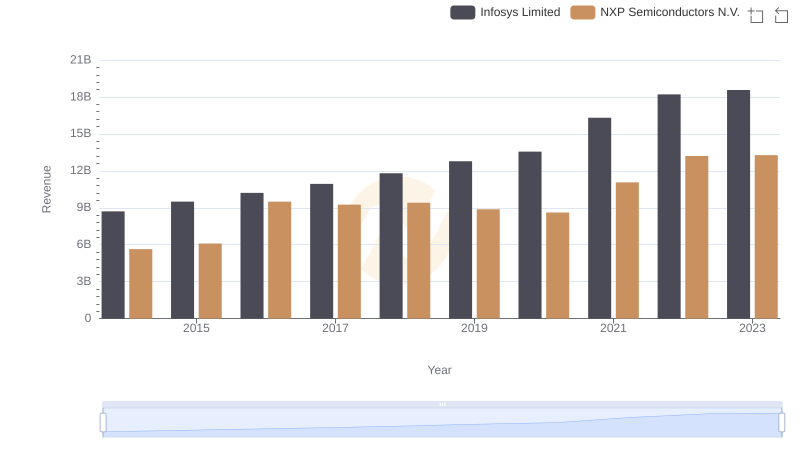
Revenue Insights: Infosys Limited and NXP Semiconductors N.V. Performance Compared
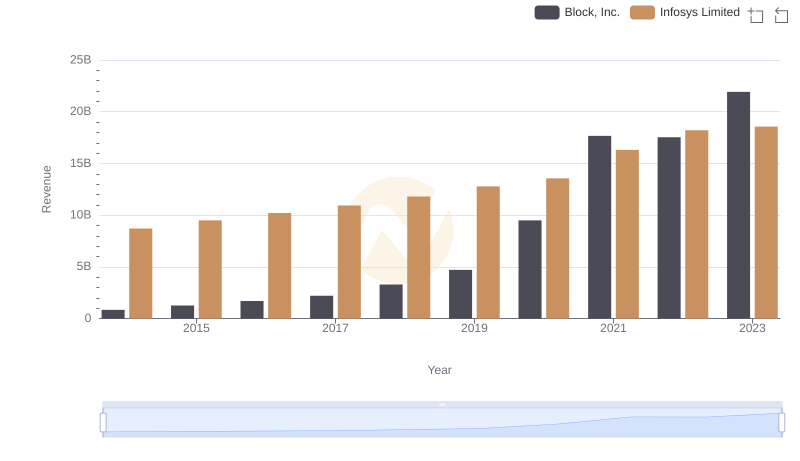
Who Generates More Revenue? Infosys Limited or Block, Inc.
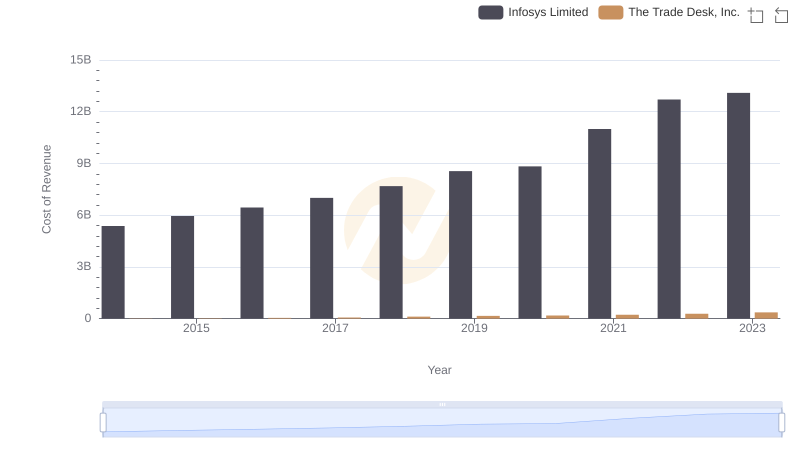
Cost of Revenue: Key Insights for Infosys Limited and The Trade Desk, Inc.
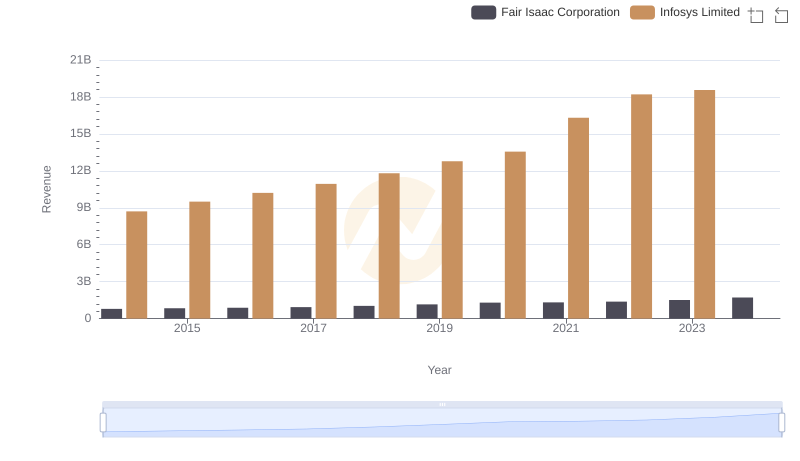
Revenue Insights: Infosys Limited and Fair Isaac Corporation Performance Compared
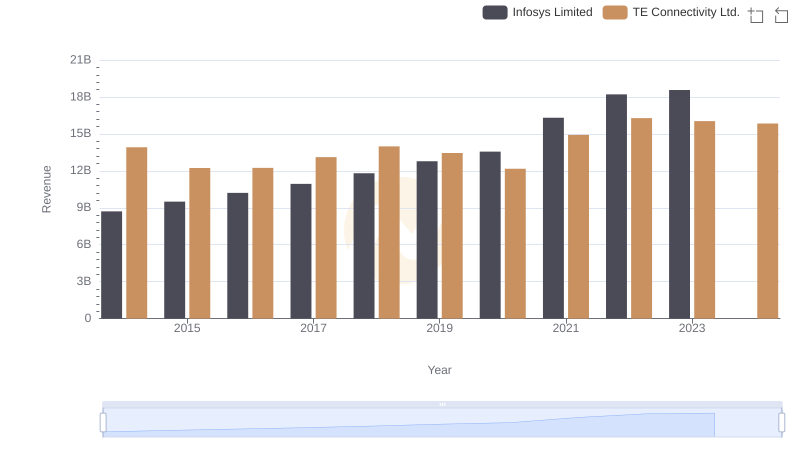
Infosys Limited or TE Connectivity Ltd.: Who Leads in Yearly Revenue?
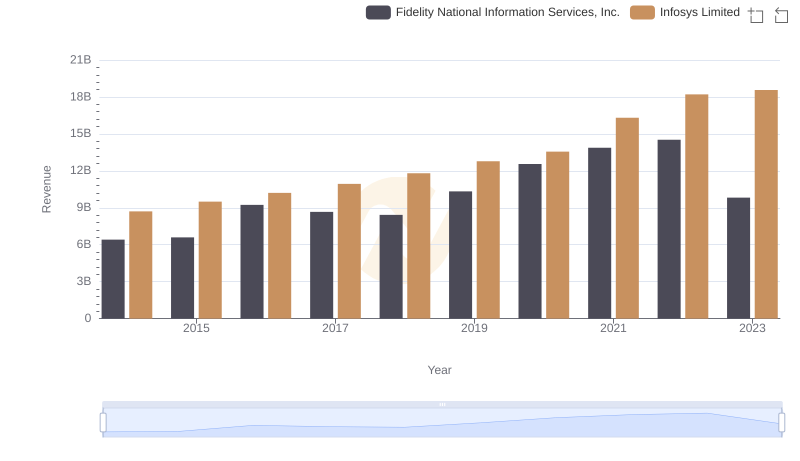
Comparing Revenue Performance: Infosys Limited or Fidelity National Information Services, Inc.?
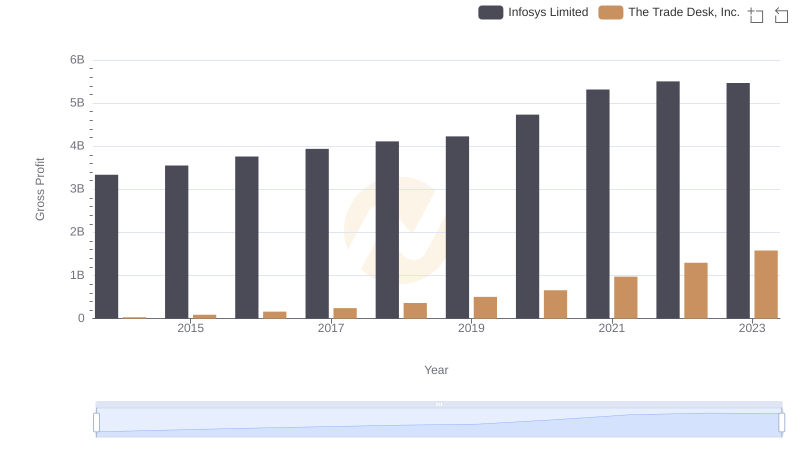
Key Insights on Gross Profit: Infosys Limited vs The Trade Desk, Inc.
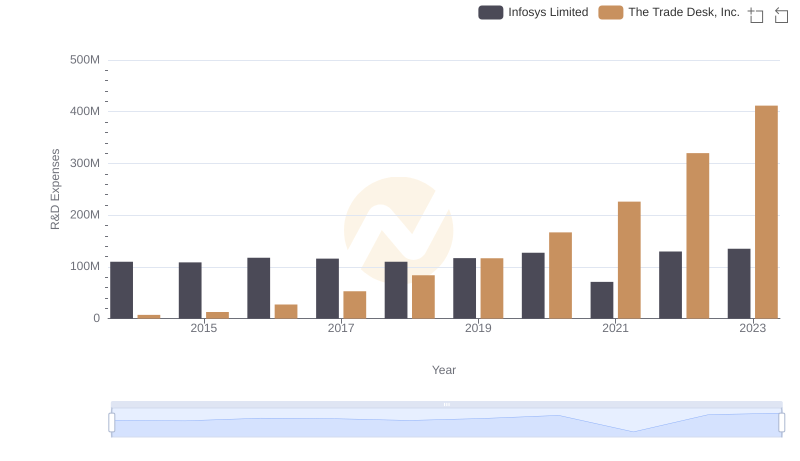
Research and Development Investment: Infosys Limited vs The Trade Desk, Inc.
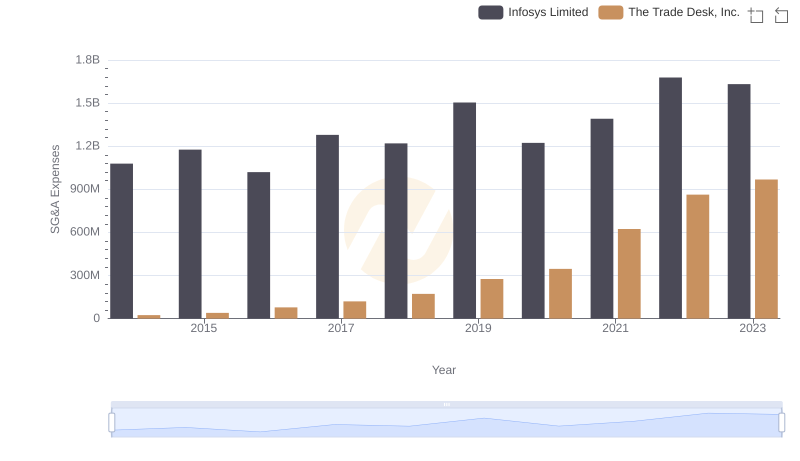
Selling, General, and Administrative Costs: Infosys Limited vs The Trade Desk, Inc.
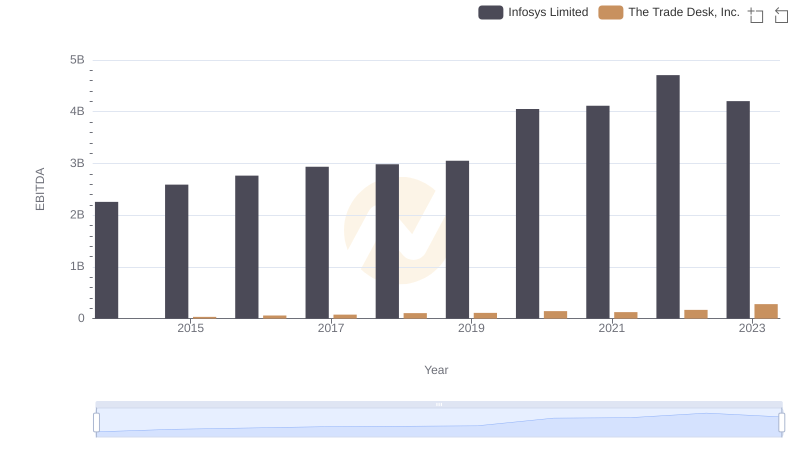
Infosys Limited and The Trade Desk, Inc.: A Detailed Examination of EBITDA Performance