| __timestamp | Autodesk, Inc. | Infosys Limited |
|---|---|---|
| Wednesday, January 1, 2014 | 1090900000 | 1079000000 |
| Thursday, January 1, 2015 | 1281300000 | 1176000000 |
| Friday, January 1, 2016 | 1308900000 | 1020000000 |
| Sunday, January 1, 2017 | 1310300000 | 1279000000 |
| Monday, January 1, 2018 | 1392500000 | 1220000000 |
| Tuesday, January 1, 2019 | 1524000000 | 1504000000 |
| Wednesday, January 1, 2020 | 1715900000 | 1223000000 |
| Friday, January 1, 2021 | 1854200000 | 1391000000 |
| Saturday, January 1, 2022 | 2194800000 | 1678000000 |
| Sunday, January 1, 2023 | 2277000000 | 1632000000 |
| Monday, January 1, 2024 | 2443000000 |
Unleashing insights
In the ever-evolving landscape of global business, understanding the spending patterns of industry leaders like Infosys Limited and Autodesk, Inc. offers invaluable insights. Over the past decade, from 2014 to 2023, Autodesk's Selling, General, and Administrative (SG&A) expenses have surged by approximately 109%, reflecting its aggressive growth strategy. In contrast, Infosys has seen a more modest increase of around 51% in the same period, indicating a more conservative approach.
Autodesk's SG&A expenses peaked in 2023, reaching nearly 2.3 billion, while Infosys recorded its highest in 2022 at about 1.7 billion. Notably, 2024 data for Infosys is missing, leaving room for speculation on its future trajectory. This comparison highlights the diverse strategies these companies employ to navigate the competitive tech landscape, offering a fascinating glimpse into their operational priorities.
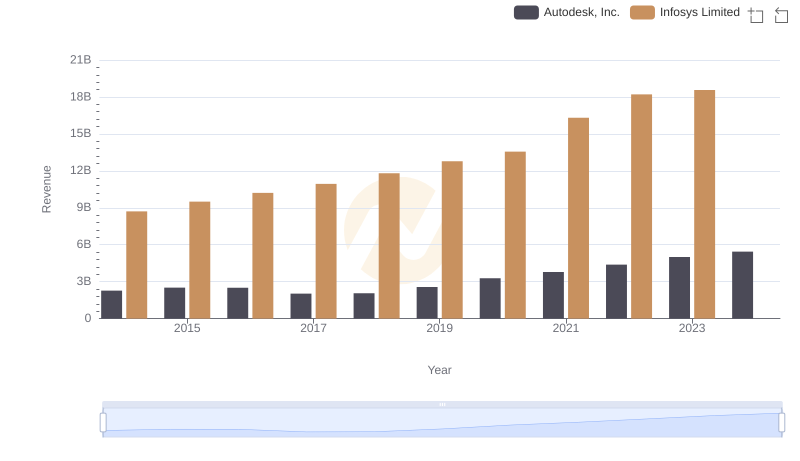
Infosys Limited vs Autodesk, Inc.: Examining Key Revenue Metrics
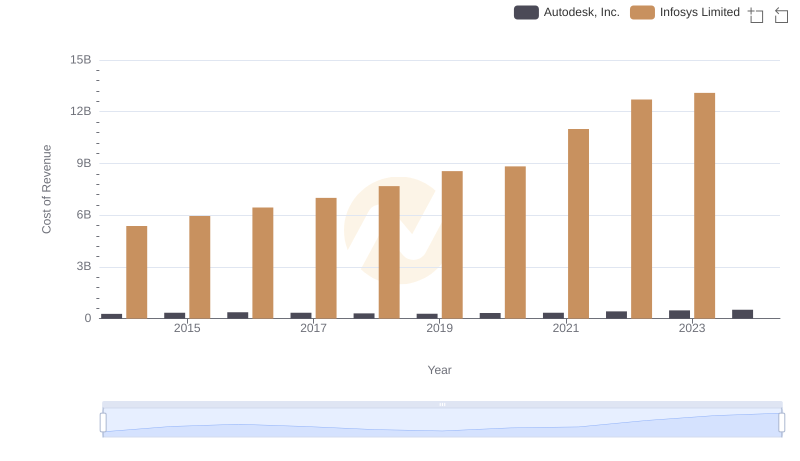
Analyzing Cost of Revenue: Infosys Limited and Autodesk, Inc.
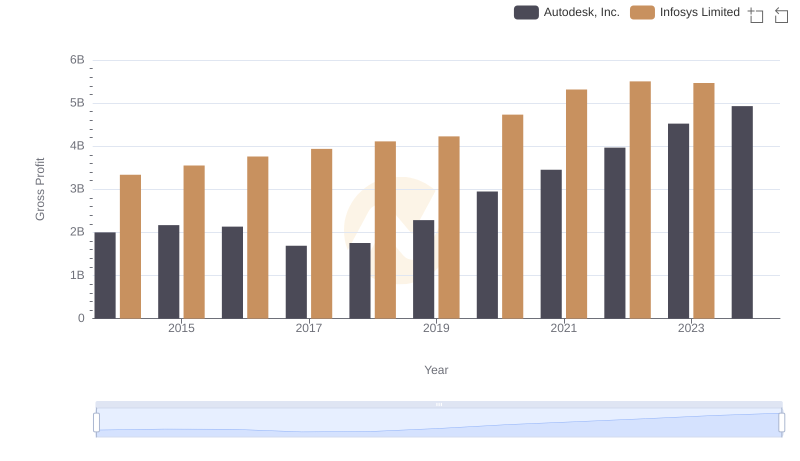
Gross Profit Comparison: Infosys Limited and Autodesk, Inc. Trends
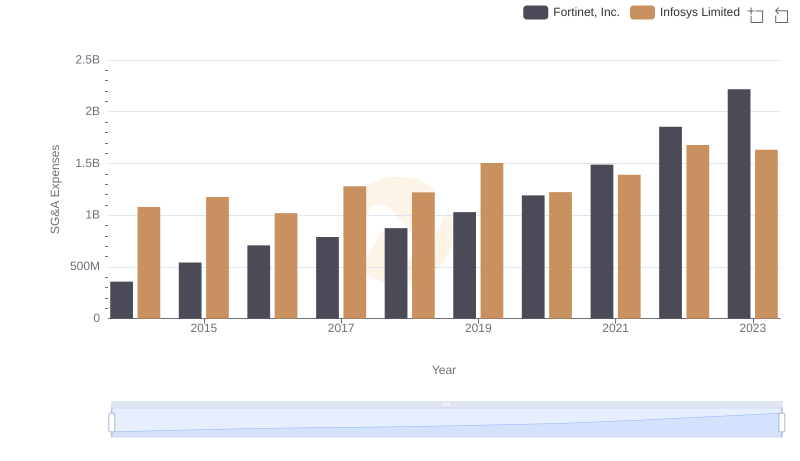
Comparing SG&A Expenses: Infosys Limited vs Fortinet, Inc. Trends and Insights
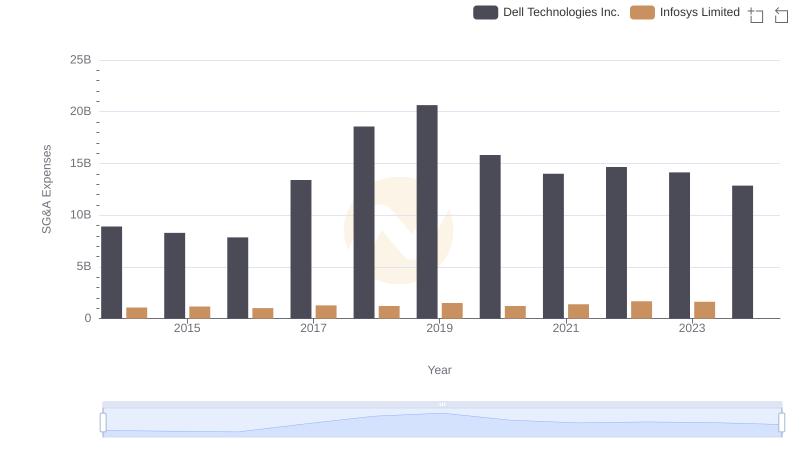
Infosys Limited or Dell Technologies Inc.: Who Manages SG&A Costs Better?
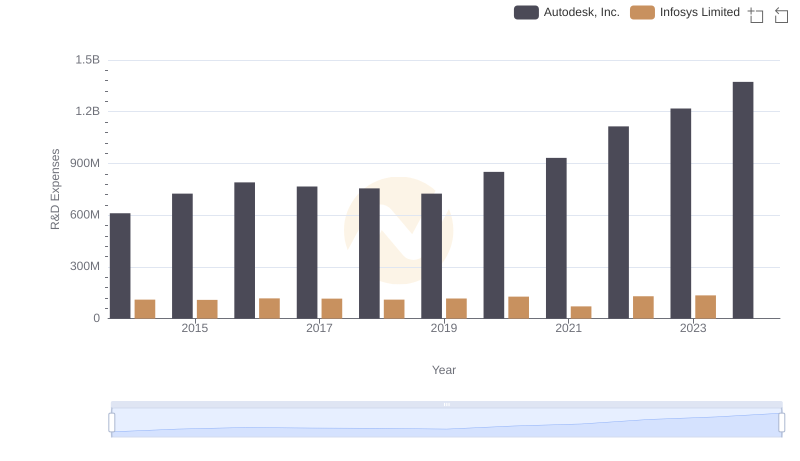
Who Prioritizes Innovation? R&D Spending Compared for Infosys Limited and Autodesk, Inc.
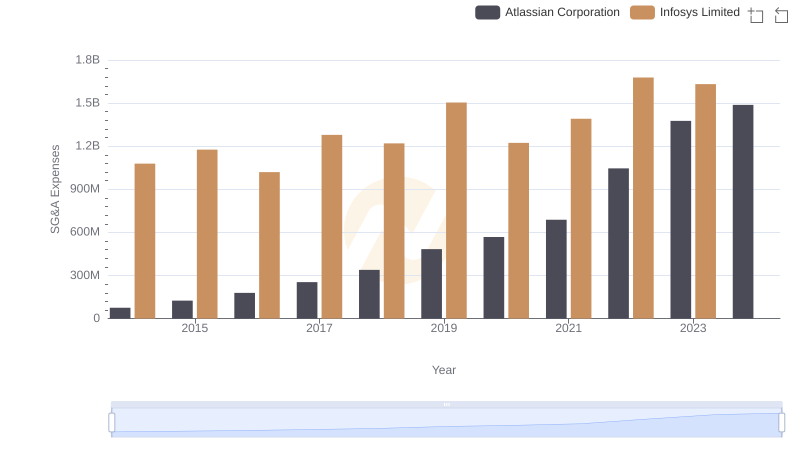
Breaking Down SG&A Expenses: Infosys Limited vs Atlassian Corporation
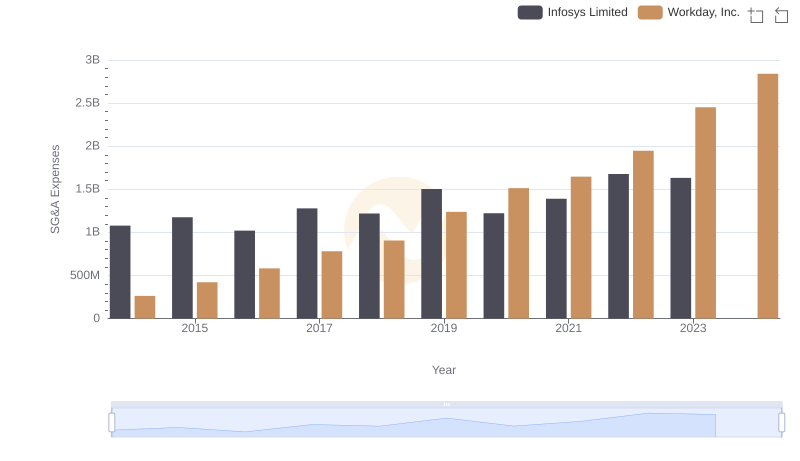
Operational Costs Compared: SG&A Analysis of Infosys Limited and Workday, Inc.
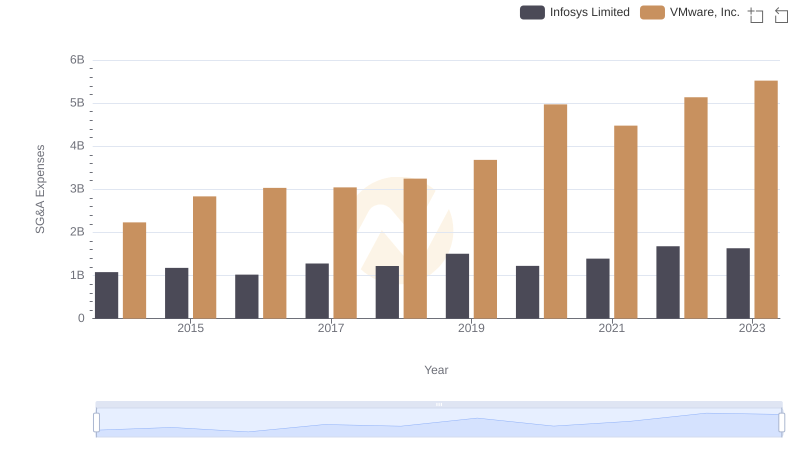
SG&A Efficiency Analysis: Comparing Infosys Limited and VMware, Inc.
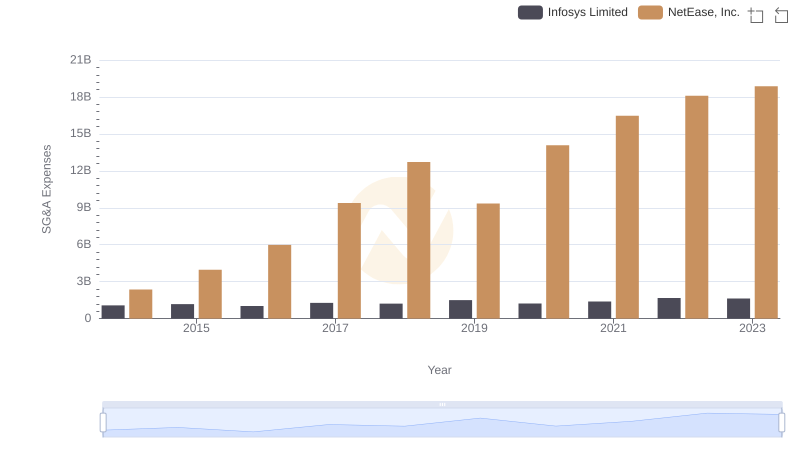
Cost Management Insights: SG&A Expenses for Infosys Limited and NetEase, Inc.
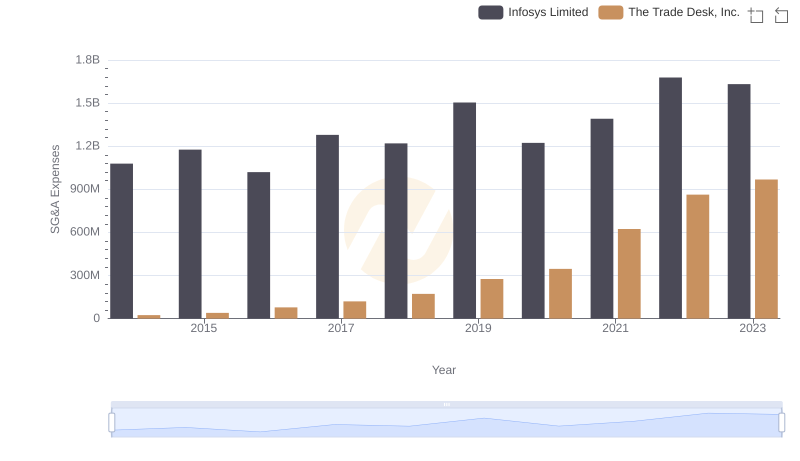
Selling, General, and Administrative Costs: Infosys Limited vs The Trade Desk, Inc.
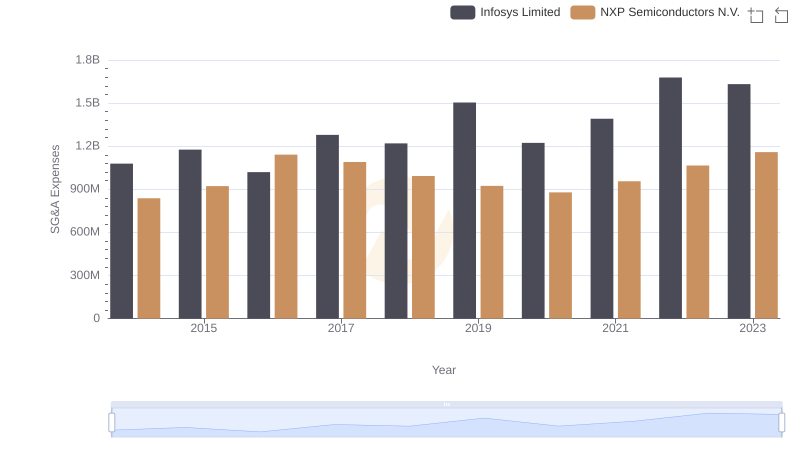
SG&A Efficiency Analysis: Comparing Infosys Limited and NXP Semiconductors N.V.