| __timestamp | Infosys Limited | Wipro Limited |
|---|---|---|
| Wednesday, January 1, 2014 | 1079000000 | 54144000000 |
| Thursday, January 1, 2015 | 1176000000 | 59142000000 |
| Friday, January 1, 2016 | 1020000000 | 64514000000 |
| Sunday, January 1, 2017 | 1279000000 | 76490000000 |
| Monday, January 1, 2018 | 1220000000 | 80461000000 |
| Tuesday, January 1, 2019 | 1504000000 | 72730000000 |
| Wednesday, January 1, 2020 | 1223000000 | 76086000000 |
| Friday, January 1, 2021 | 1391000000 | 93805000000 |
| Saturday, January 1, 2022 | 1678000000 | 114803000000 |
| Sunday, January 1, 2023 | 1632000000 | 119755000000 |
| Monday, January 1, 2024 | 127509000000 |
Igniting the spark of knowledge
In the ever-evolving landscape of the IT industry, effective cost management is crucial. This chart provides a decade-long insight into the Selling, General, and Administrative (SG&A) expenses of two Indian IT behemoths: Infosys Limited and Wipro Limited. From 2014 to 2023, Wipro's SG&A expenses have consistently outpaced those of Infosys, with Wipro's 2023 expenses reaching approximately 120% more than Infosys. Notably, Infosys saw a significant increase in 2022, with expenses rising by 22% compared to the previous year. Meanwhile, Wipro's expenses have shown a steady upward trend, peaking in 2024. However, data for Infosys in 2024 is missing, leaving a gap in the comparative analysis. This financial narrative underscores the strategic importance of SG&A management in maintaining competitive advantage in the global IT sector.
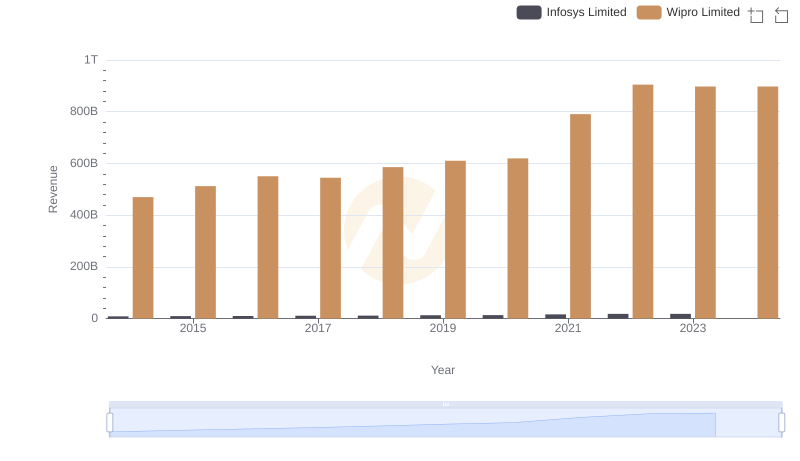
Infosys Limited vs Wipro Limited: Examining Key Revenue Metrics
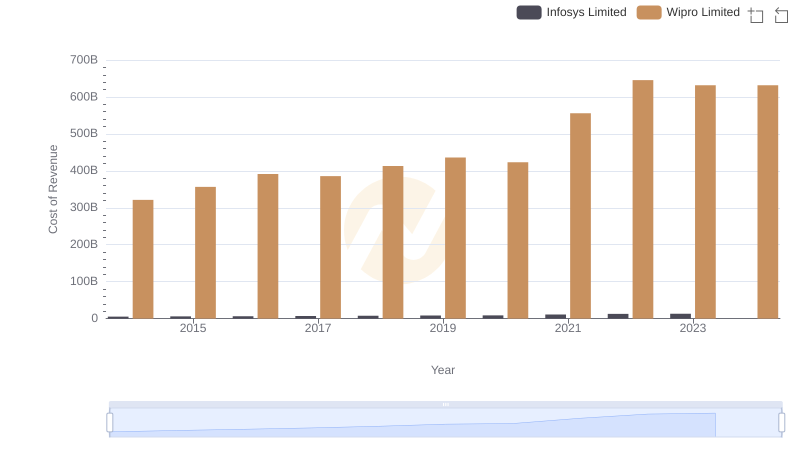
Comparing Cost of Revenue Efficiency: Infosys Limited vs Wipro Limited
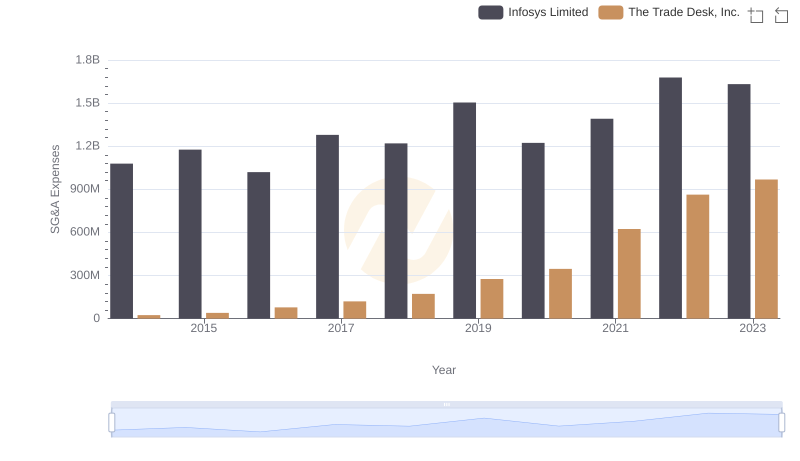
Selling, General, and Administrative Costs: Infosys Limited vs The Trade Desk, Inc.
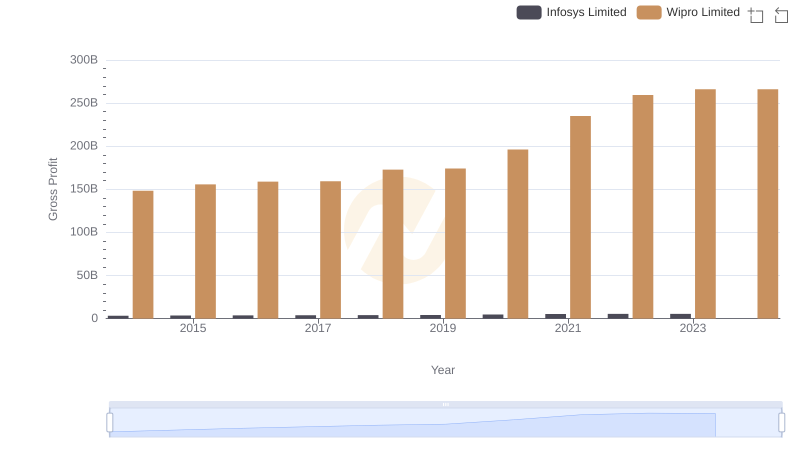
Gross Profit Trends Compared: Infosys Limited vs Wipro Limited
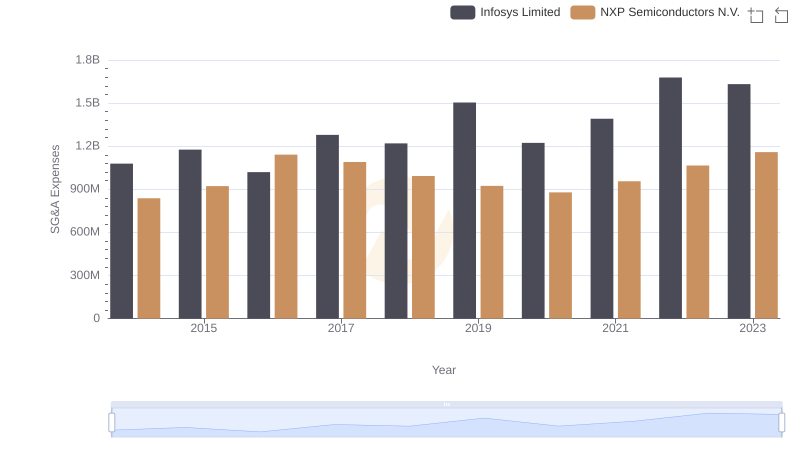
SG&A Efficiency Analysis: Comparing Infosys Limited and NXP Semiconductors N.V.
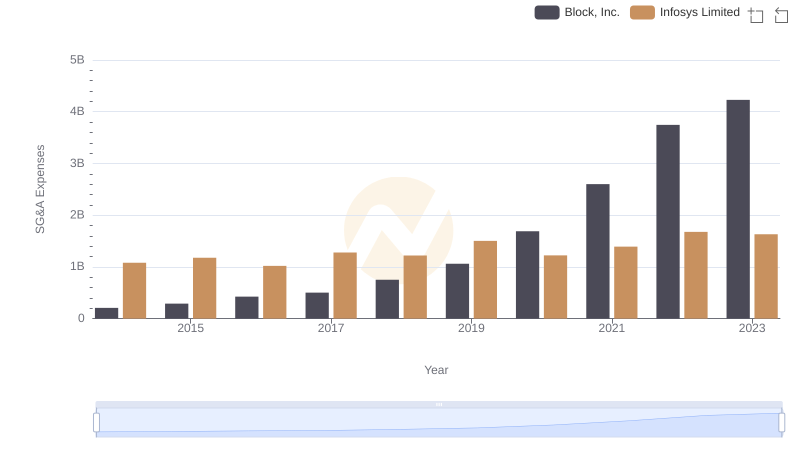
Infosys Limited vs Block, Inc.: SG&A Expense Trends
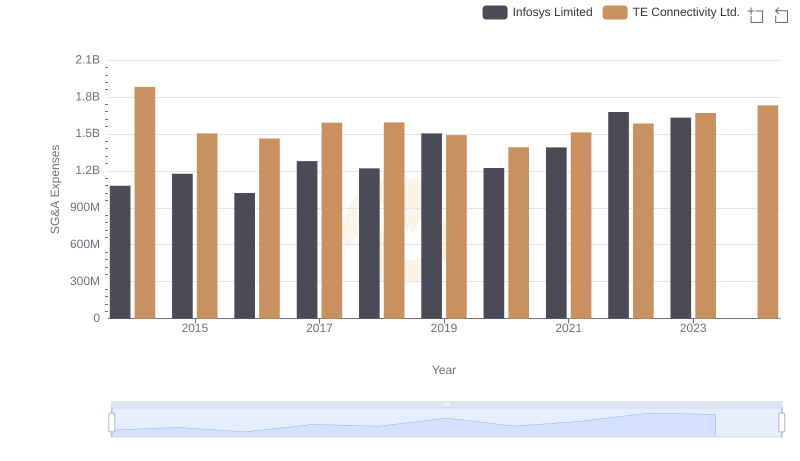
Breaking Down SG&A Expenses: Infosys Limited vs TE Connectivity Ltd.
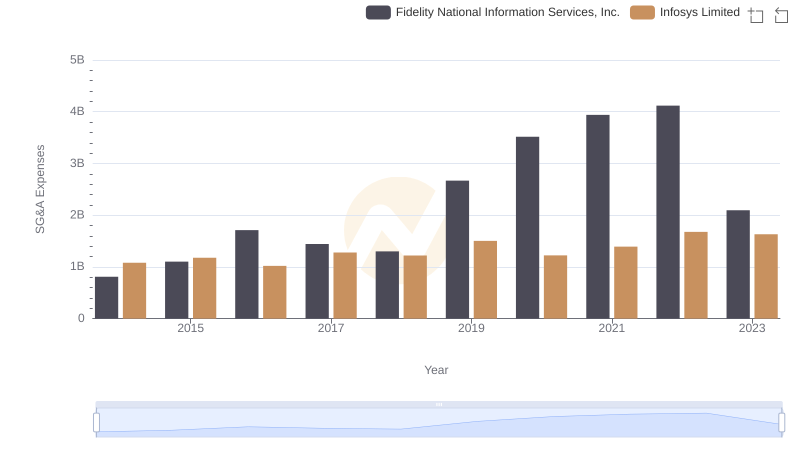
Operational Costs Compared: SG&A Analysis of Infosys Limited and Fidelity National Information Services, Inc.
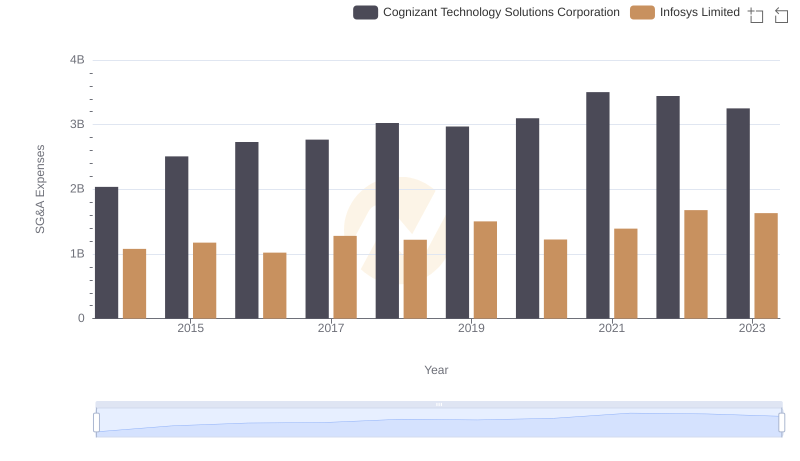
Infosys Limited and Cognizant Technology Solutions Corporation: SG&A Spending Patterns Compared
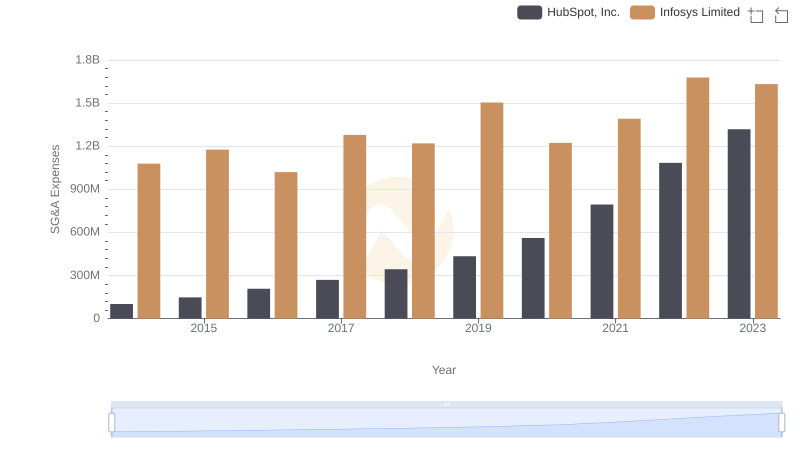
Infosys Limited or HubSpot, Inc.: Who Manages SG&A Costs Better?
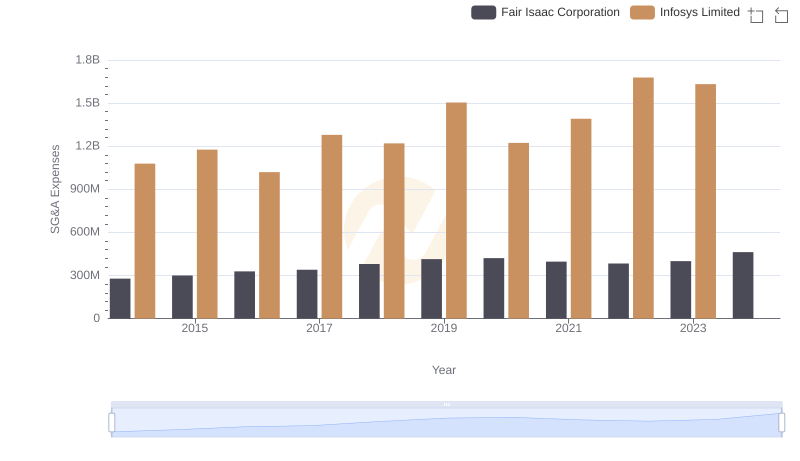
Who Optimizes SG&A Costs Better? Infosys Limited or Fair Isaac Corporation
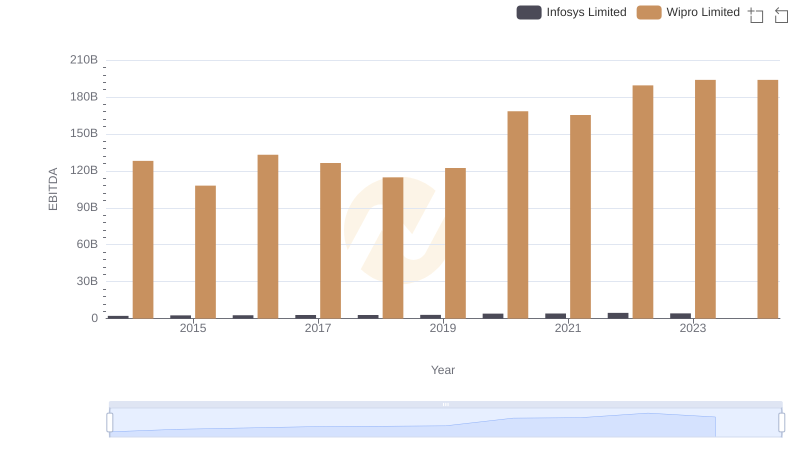
Comparative EBITDA Analysis: Infosys Limited vs Wipro Limited