| __timestamp | Infosys Limited | Workday, Inc. |
|---|---|---|
| Wednesday, January 1, 2014 | 1079000000 | 263294000 |
| Thursday, January 1, 2015 | 1176000000 | 421891000 |
| Friday, January 1, 2016 | 1020000000 | 582634000 |
| Sunday, January 1, 2017 | 1279000000 | 781996000 |
| Monday, January 1, 2018 | 1220000000 | 906276000 |
| Tuesday, January 1, 2019 | 1504000000 | 1238682000 |
| Wednesday, January 1, 2020 | 1223000000 | 1514272000 |
| Friday, January 1, 2021 | 1391000000 | 1647241000 |
| Saturday, January 1, 2022 | 1678000000 | 1947933000 |
| Sunday, January 1, 2023 | 1632000000 | 2452180000 |
| Monday, January 1, 2024 | 2841000000 |
In pursuit of knowledge
In the ever-evolving landscape of global business, operational efficiency is paramount. This analysis delves into the Selling, General, and Administrative (SG&A) expenses of two industry giants: Infosys Limited and Workday, Inc., from 2014 to 2023. Over this decade, Infosys has maintained a relatively stable SG&A expense, averaging around $1.32 billion annually. However, Workday's SG&A expenses have surged, growing nearly tenfold from 2014 to 2023, reflecting its aggressive expansion strategy.
By 2023, Workday's SG&A expenses reached approximately $2.45 billion, surpassing Infosys's $1.63 billion. This trend highlights Workday's rapid growth trajectory in the tech sector. Notably, 2024 data for Infosys is missing, indicating potential reporting delays or strategic shifts. This comparative analysis underscores the diverse strategies of these tech titans in managing operational costs.
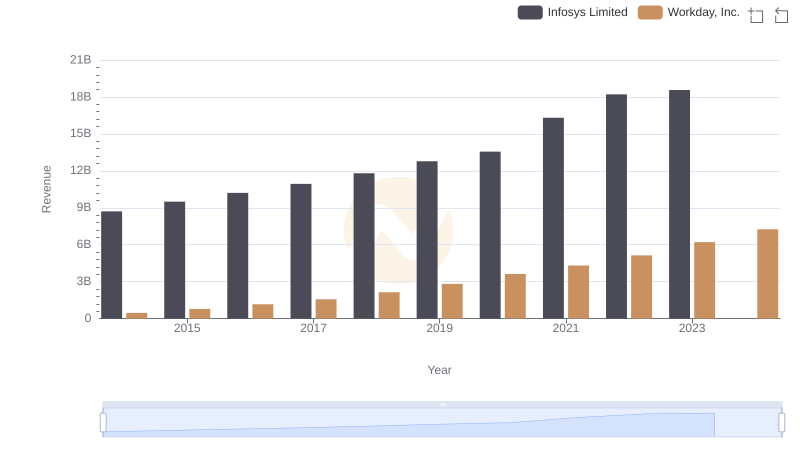
Revenue Showdown: Infosys Limited vs Workday, Inc.
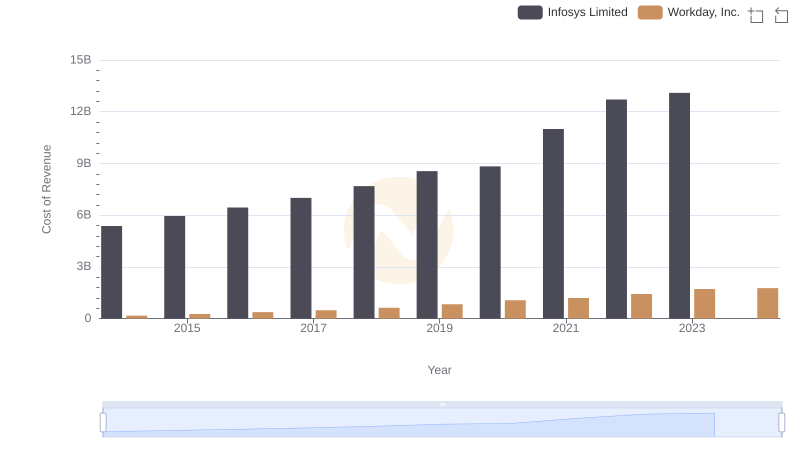
Cost of Revenue Trends: Infosys Limited vs Workday, Inc.
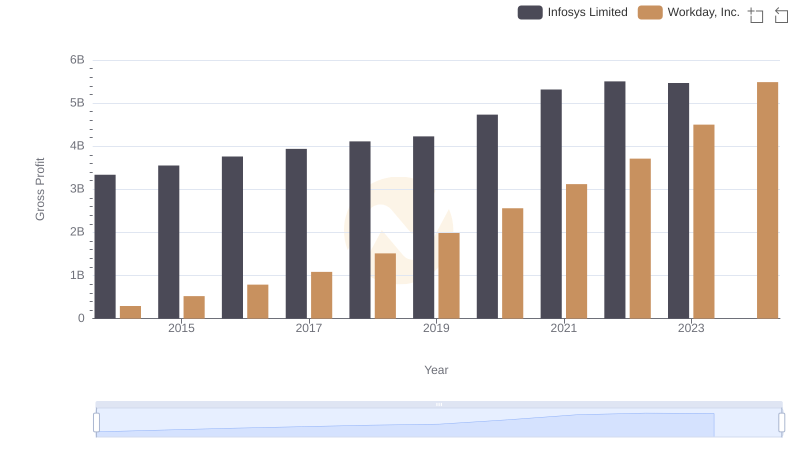
Key Insights on Gross Profit: Infosys Limited vs Workday, Inc.
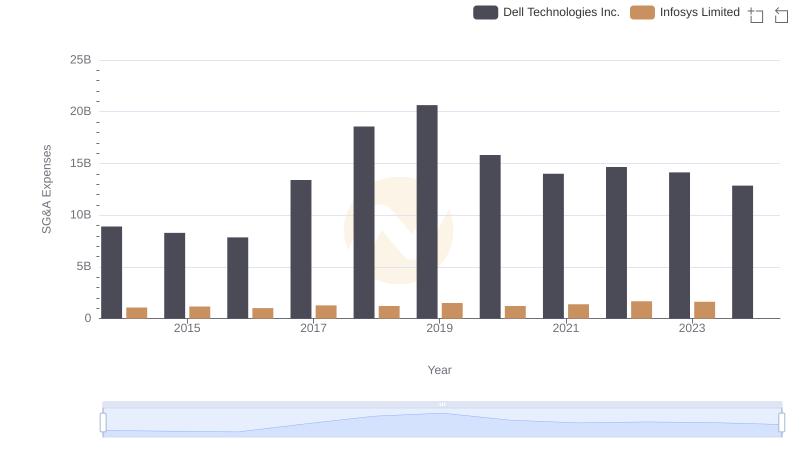
Infosys Limited or Dell Technologies Inc.: Who Manages SG&A Costs Better?
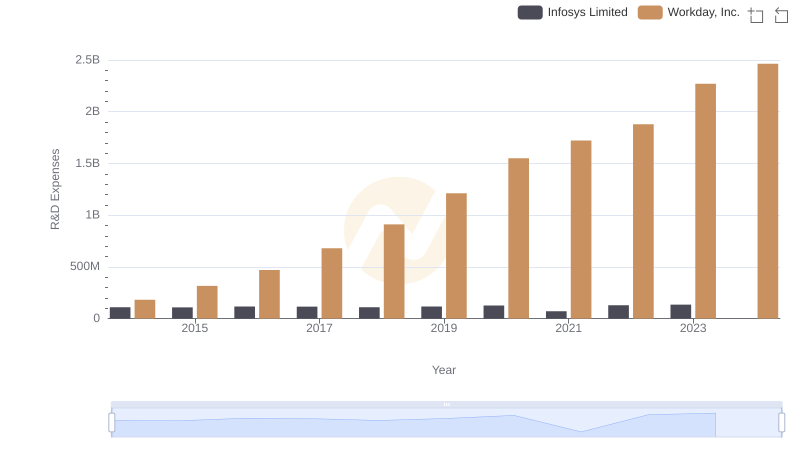
Infosys Limited vs Workday, Inc.: Strategic Focus on R&D Spending
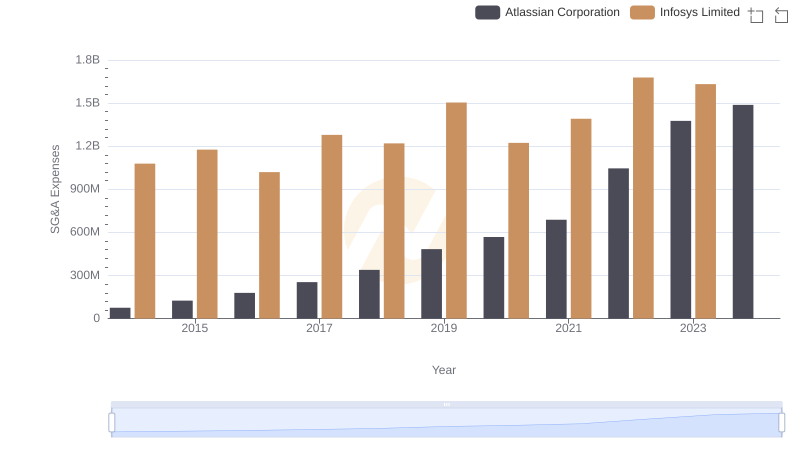
Breaking Down SG&A Expenses: Infosys Limited vs Atlassian Corporation
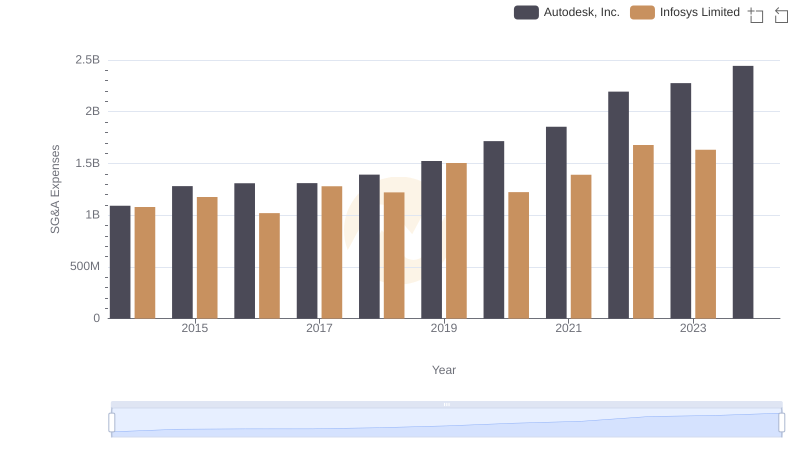
Infosys Limited and Autodesk, Inc.: SG&A Spending Patterns Compared
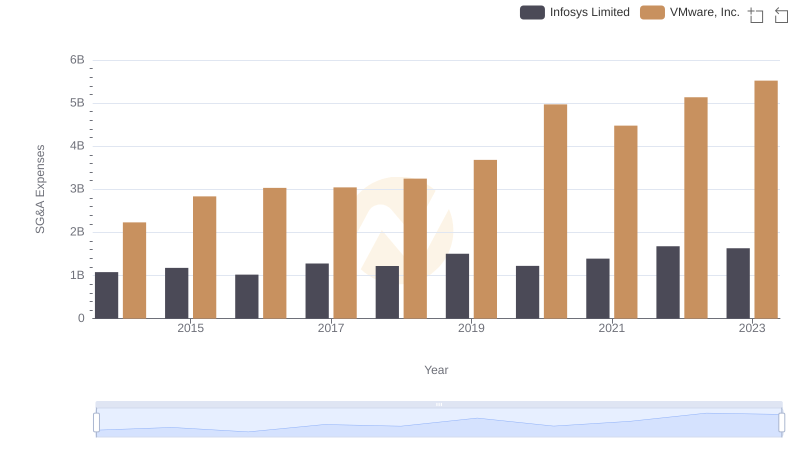
SG&A Efficiency Analysis: Comparing Infosys Limited and VMware, Inc.
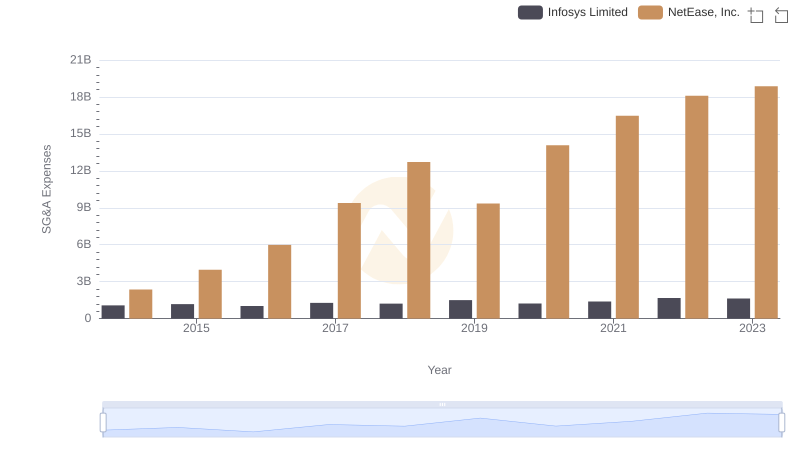
Cost Management Insights: SG&A Expenses for Infosys Limited and NetEase, Inc.
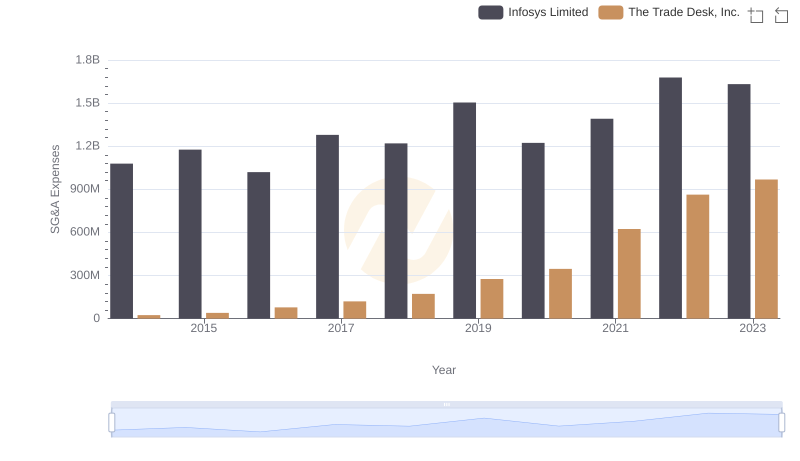
Selling, General, and Administrative Costs: Infosys Limited vs The Trade Desk, Inc.
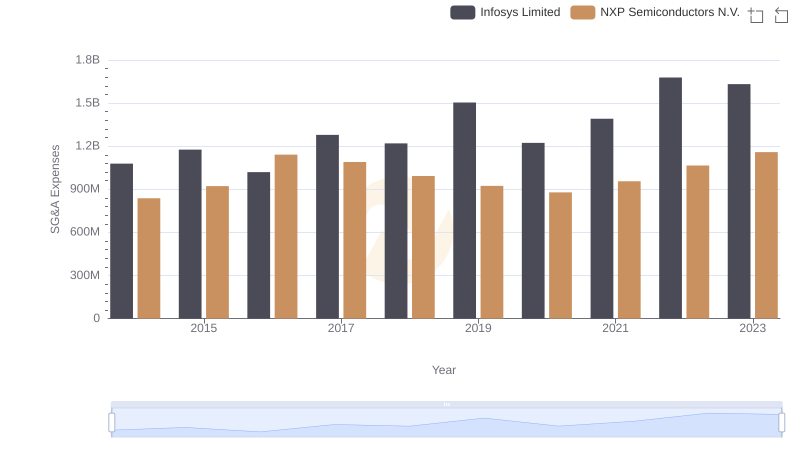
SG&A Efficiency Analysis: Comparing Infosys Limited and NXP Semiconductors N.V.
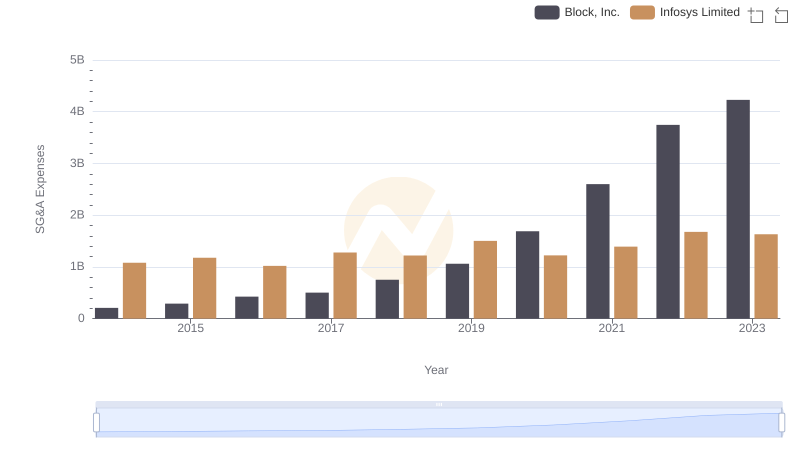
Infosys Limited vs Block, Inc.: SG&A Expense Trends