| __timestamp | Block, Inc. | Infosys Limited |
|---|---|---|
| Wednesday, January 1, 2014 | 206797000 | 1079000000 |
| Thursday, January 1, 2015 | 289084000 | 1176000000 |
| Friday, January 1, 2016 | 425869000 | 1020000000 |
| Sunday, January 1, 2017 | 503723000 | 1279000000 |
| Monday, January 1, 2018 | 750396000 | 1220000000 |
| Tuesday, January 1, 2019 | 1061082000 | 1504000000 |
| Wednesday, January 1, 2020 | 1688873000 | 1223000000 |
| Friday, January 1, 2021 | 2600515000 | 1391000000 |
| Saturday, January 1, 2022 | 3744800000 | 1678000000 |
| Sunday, January 1, 2023 | 4228199000 | 1632000000 |
Unveiling the hidden dimensions of data
In the ever-evolving landscape of global business, understanding the financial strategies of leading companies is crucial. This analysis delves into the Selling, General, and Administrative (SG&A) expenses of two industry giants: Infosys Limited and Block, Inc., from 2014 to 2023.
Over the past decade, Block, Inc. has seen a staggering increase in SG&A expenses, growing by over 1,900% from 2014 to 2023. This reflects the company's aggressive expansion and investment in operational capabilities. In contrast, Infosys Limited's SG&A expenses have grown by approximately 51% during the same period, indicating a more conservative and steady approach.
While Block, Inc.'s rapid increase in expenses suggests a focus on scaling and market penetration, Infosys Limited's stable growth highlights its emphasis on efficiency and cost management. These trends offer valuable insights into the strategic priorities of these companies, providing a window into their future trajectories.
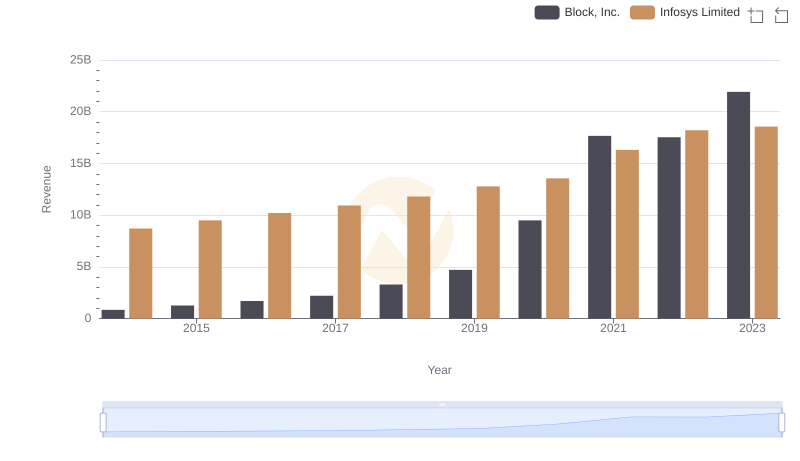
Who Generates More Revenue? Infosys Limited or Block, Inc.
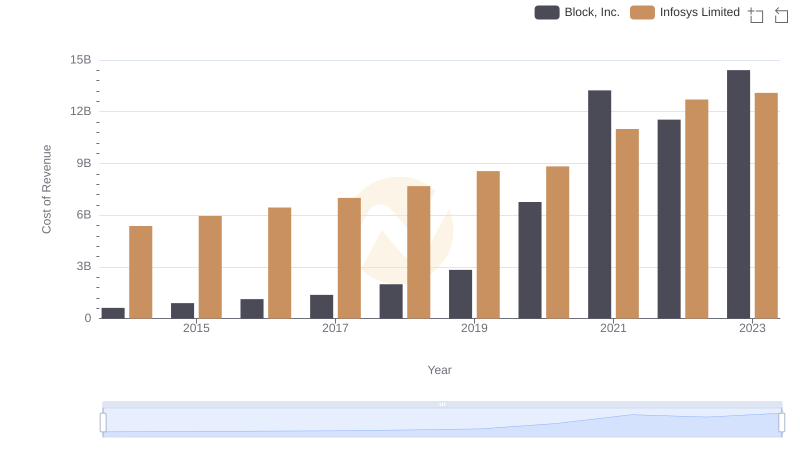
Cost Insights: Breaking Down Infosys Limited and Block, Inc.'s Expenses
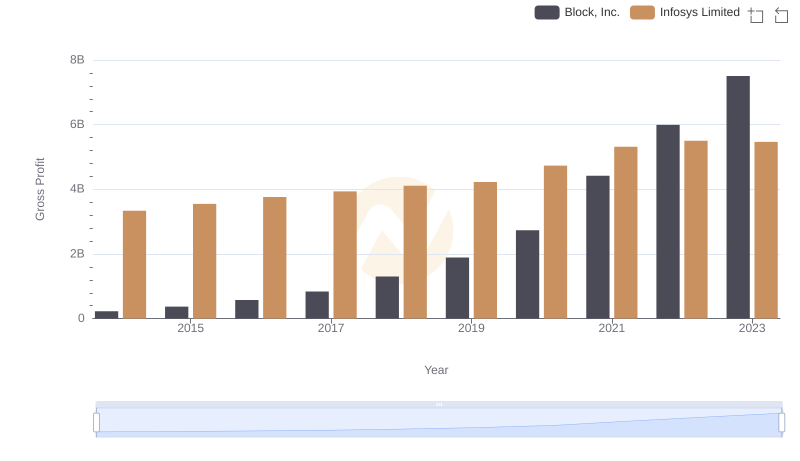
Gross Profit Comparison: Infosys Limited and Block, Inc. Trends
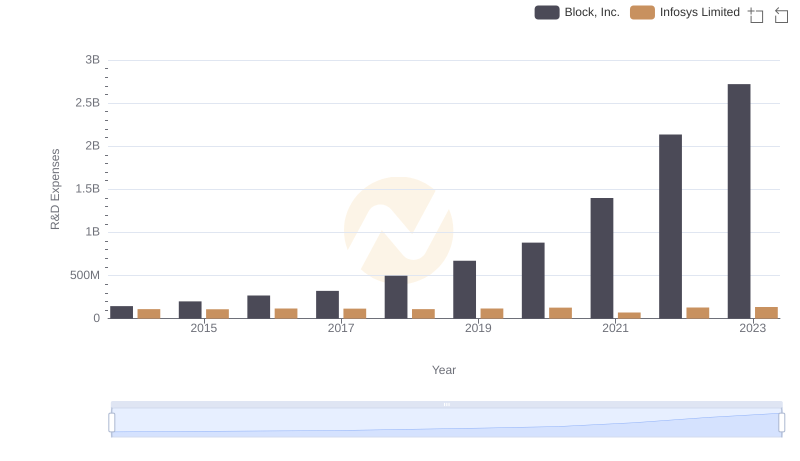
R&D Insights: How Infosys Limited and Block, Inc. Allocate Funds
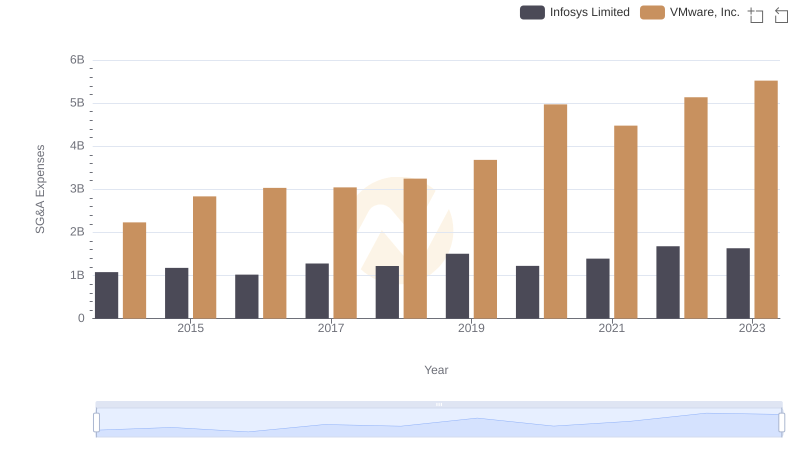
SG&A Efficiency Analysis: Comparing Infosys Limited and VMware, Inc.
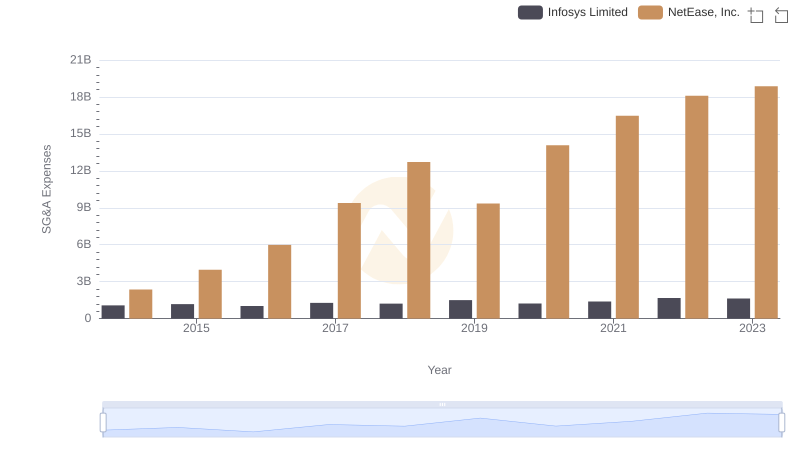
Cost Management Insights: SG&A Expenses for Infosys Limited and NetEase, Inc.
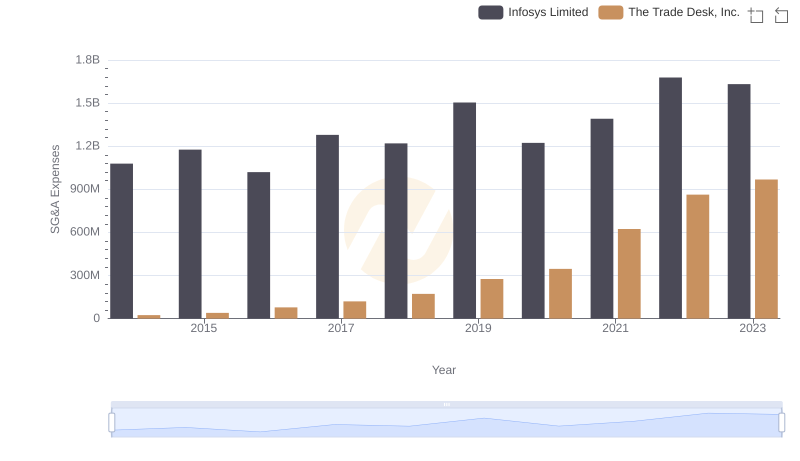
Selling, General, and Administrative Costs: Infosys Limited vs The Trade Desk, Inc.
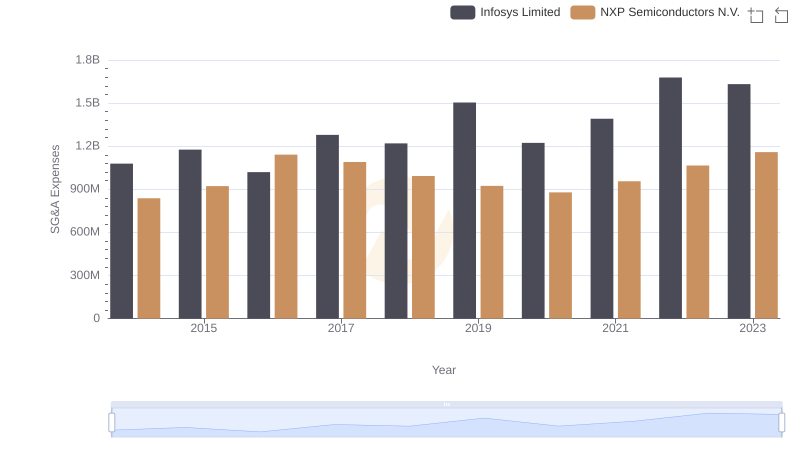
SG&A Efficiency Analysis: Comparing Infosys Limited and NXP Semiconductors N.V.
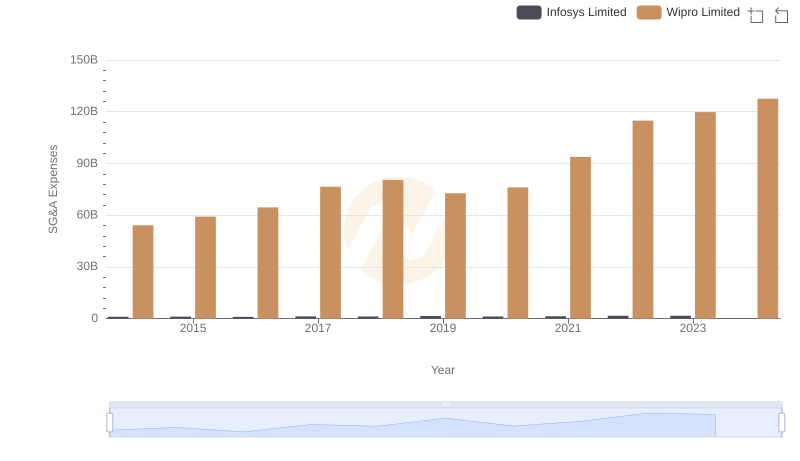
Cost Management Insights: SG&A Expenses for Infosys Limited and Wipro Limited
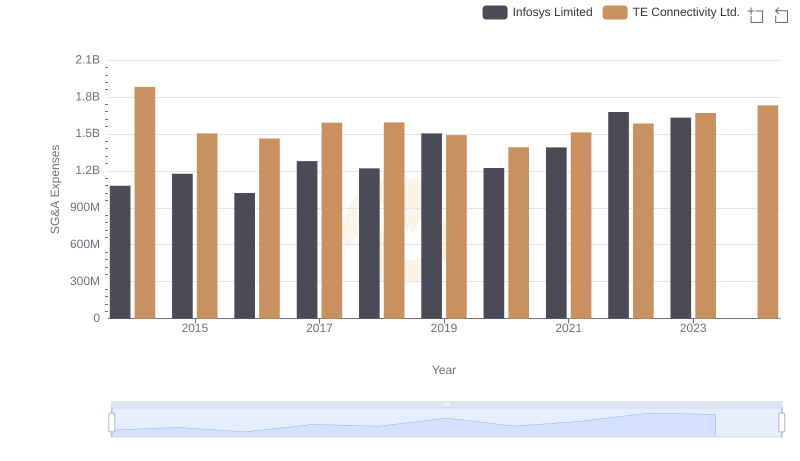
Breaking Down SG&A Expenses: Infosys Limited vs TE Connectivity Ltd.
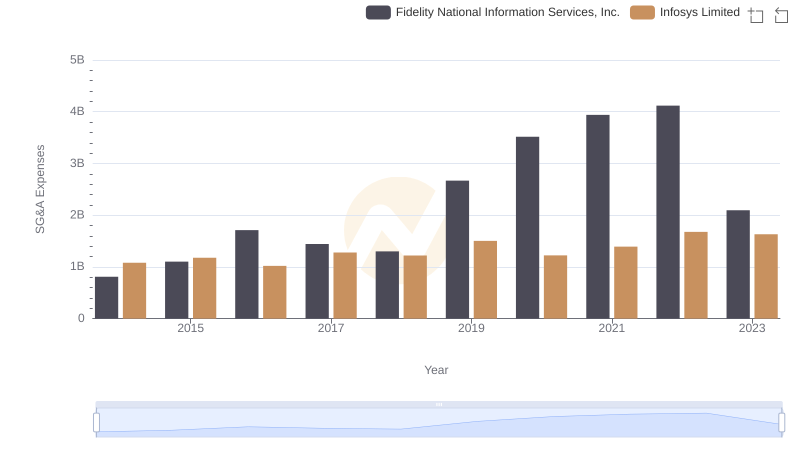
Operational Costs Compared: SG&A Analysis of Infosys Limited and Fidelity National Information Services, Inc.
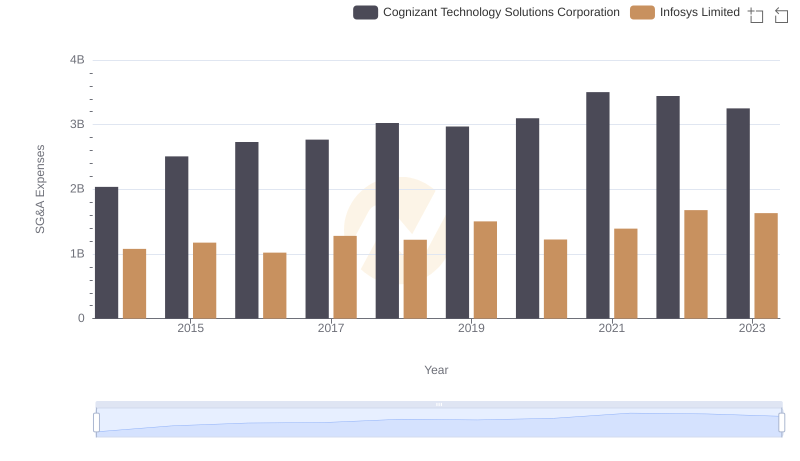
Infosys Limited and Cognizant Technology Solutions Corporation: SG&A Spending Patterns Compared