| __timestamp | Infosys Limited | The Trade Desk, Inc. |
|---|---|---|
| Wednesday, January 1, 2014 | 5374000000 | 12559000 |
| Thursday, January 1, 2015 | 5950000000 | 22967000 |
| Friday, January 1, 2016 | 6446000000 | 39876000 |
| Sunday, January 1, 2017 | 7001000000 | 66230000 |
| Monday, January 1, 2018 | 7687000000 | 114098000 |
| Tuesday, January 1, 2019 | 8552000000 | 156180000 |
| Wednesday, January 1, 2020 | 8828000000 | 178812000 |
| Friday, January 1, 2021 | 10996000000 | 221554000 |
| Saturday, January 1, 2022 | 12709000000 | 281123000 |
| Sunday, January 1, 2023 | 13096000000 | 365598000 |
| Monday, January 1, 2024 | 472012000 |
Unleashing insights
In the ever-evolving landscape of global business, understanding the cost of revenue is crucial for evaluating a company's financial health. This analysis focuses on Infosys Limited and The Trade Desk, Inc., two giants in their respective industries. Over the past decade, Infosys has seen a steady increase in its cost of revenue, growing by approximately 144% from 2014 to 2023. This reflects its expanding operations and market reach. In contrast, The Trade Desk, Inc. has experienced a staggering 2,815% increase in the same period, highlighting its rapid growth and scaling efforts in the digital advertising space.
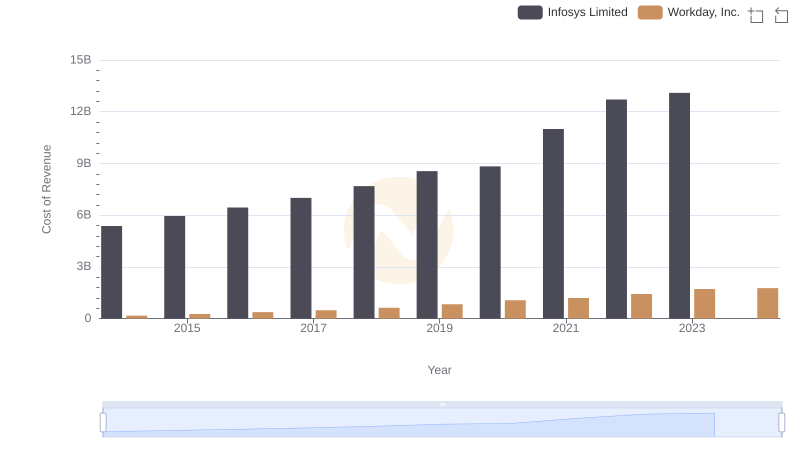
Cost of Revenue Trends: Infosys Limited vs Workday, Inc.
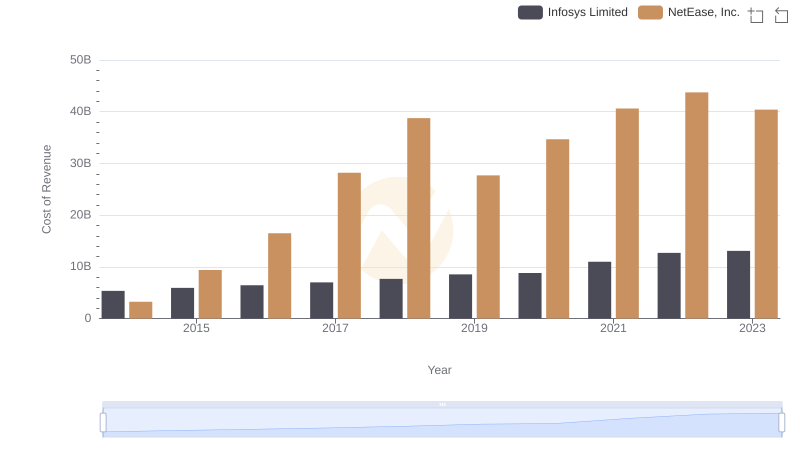
Cost of Revenue Trends: Infosys Limited vs NetEase, Inc.
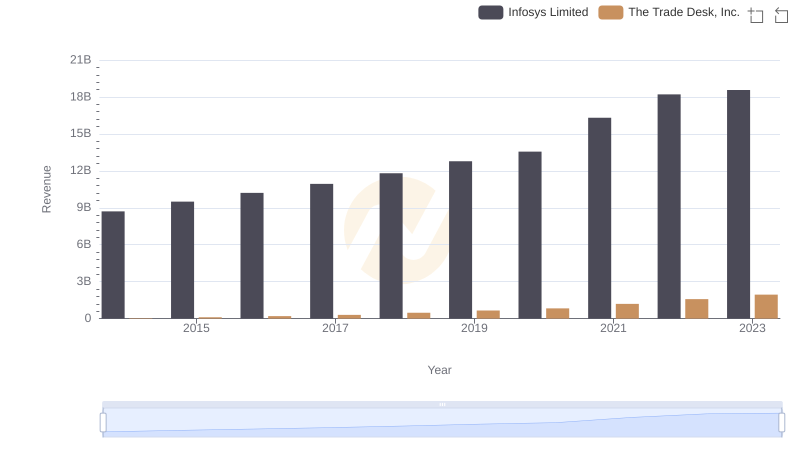
Annual Revenue Comparison: Infosys Limited vs The Trade Desk, Inc.
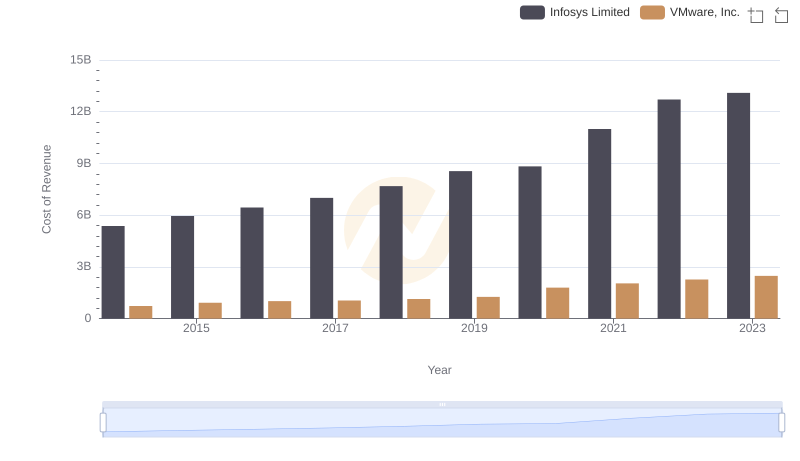
Cost Insights: Breaking Down Infosys Limited and VMware, Inc.'s Expenses
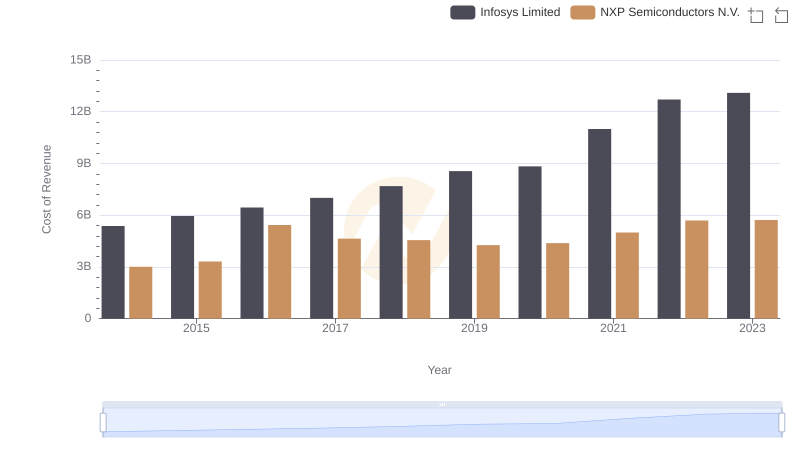
Analyzing Cost of Revenue: Infosys Limited and NXP Semiconductors N.V.
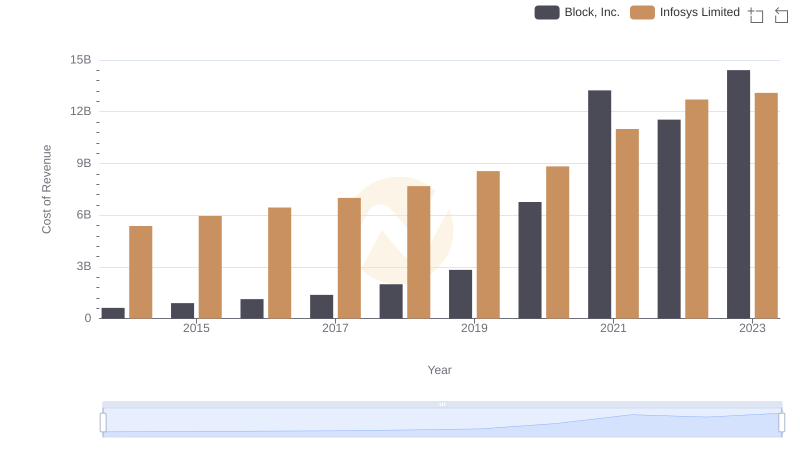
Cost Insights: Breaking Down Infosys Limited and Block, Inc.'s Expenses
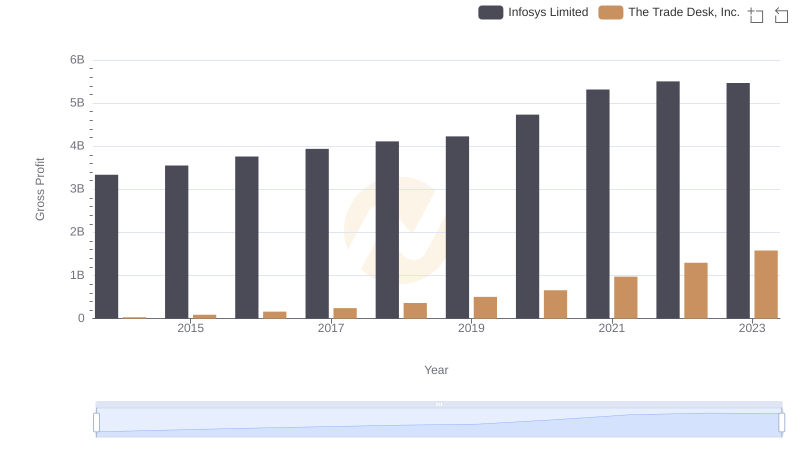
Key Insights on Gross Profit: Infosys Limited vs The Trade Desk, Inc.
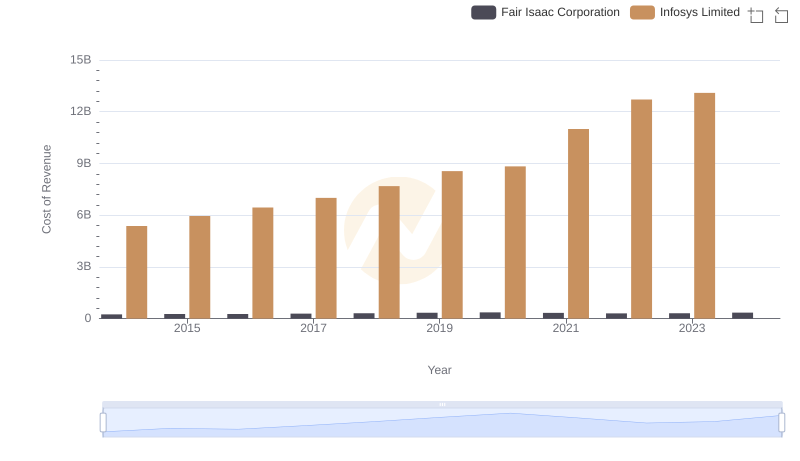
Cost Insights: Breaking Down Infosys Limited and Fair Isaac Corporation's Expenses
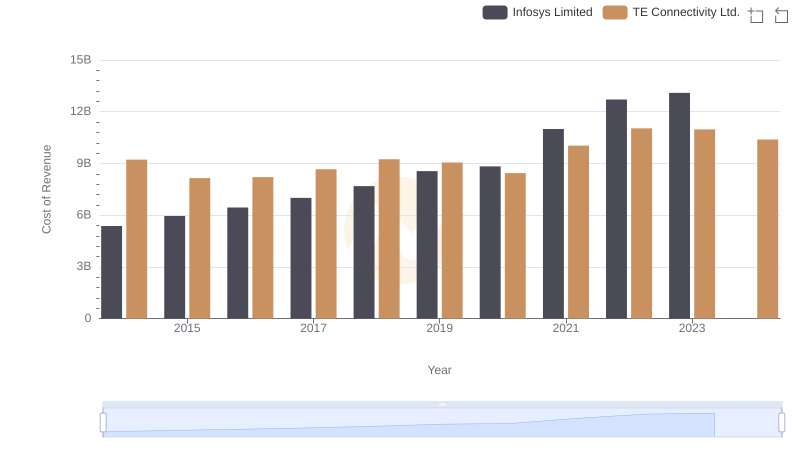
Cost Insights: Breaking Down Infosys Limited and TE Connectivity Ltd.'s Expenses
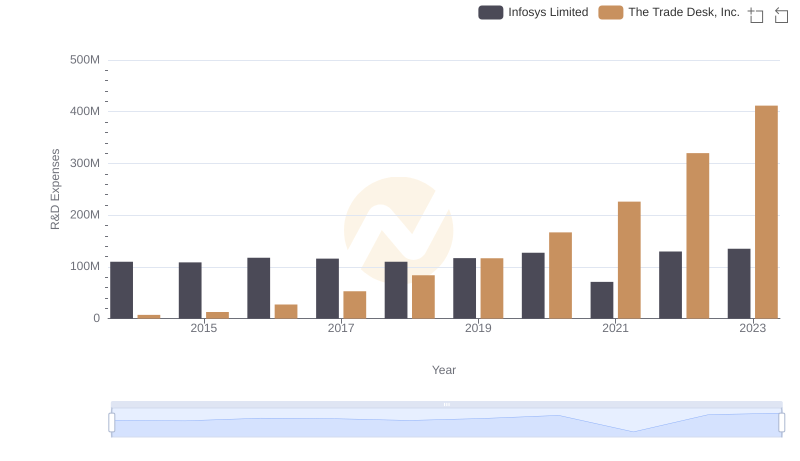
Research and Development Investment: Infosys Limited vs The Trade Desk, Inc.
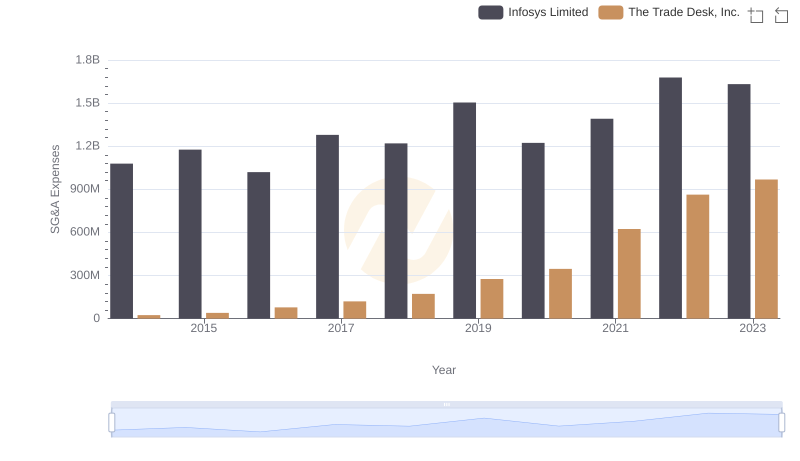
Selling, General, and Administrative Costs: Infosys Limited vs The Trade Desk, Inc.
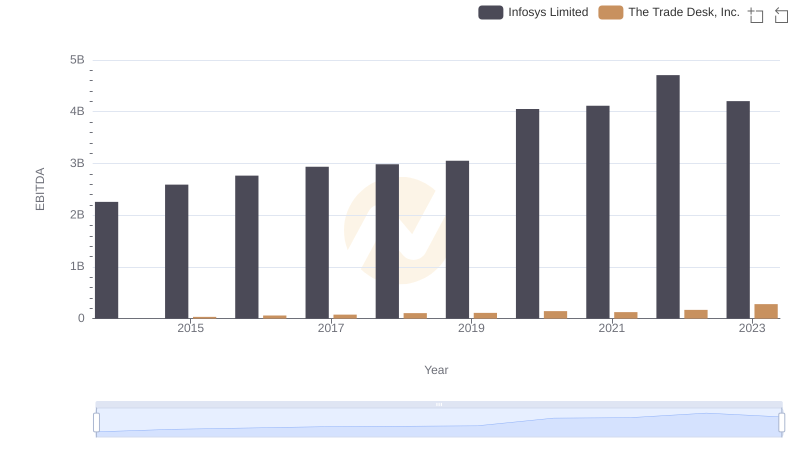
Infosys Limited and The Trade Desk, Inc.: A Detailed Examination of EBITDA Performance