| __timestamp | EMCOR Group, Inc. | RB Global, Inc. |
|---|---|---|
| Wednesday, January 1, 2014 | 626478000 | 248220000 |
| Thursday, January 1, 2015 | 656573000 | 254990000 |
| Friday, January 1, 2016 | 725538000 | 283529000 |
| Sunday, January 1, 2017 | 757062000 | 323270000 |
| Monday, January 1, 2018 | 799157000 | 382676000 |
| Tuesday, January 1, 2019 | 893453000 | 382389000 |
| Wednesday, January 1, 2020 | 903584000 | 417523000 |
| Friday, January 1, 2021 | 970937000 | 464599000 |
| Saturday, January 1, 2022 | 1038717000 | 539933000 |
| Sunday, January 1, 2023 | 1211233000 | 743700000 |
| Monday, January 1, 2024 | 773900000 |
Cracking the code
In the competitive landscape of corporate America, understanding spending patterns is crucial. Over the past decade, EMCOR Group, Inc. and RB Global, Inc. have shown distinct trends in their Selling, General, and Administrative (SG&A) expenses. From 2014 to 2023, EMCOR's SG&A expenses surged by approximately 93%, reflecting a strategic expansion and operational scaling. In contrast, RB Global's expenses grew by about 200%, indicating a more aggressive growth strategy.
These trends underscore the differing strategic priorities of these industry giants, offering valuable insights for investors and analysts alike.
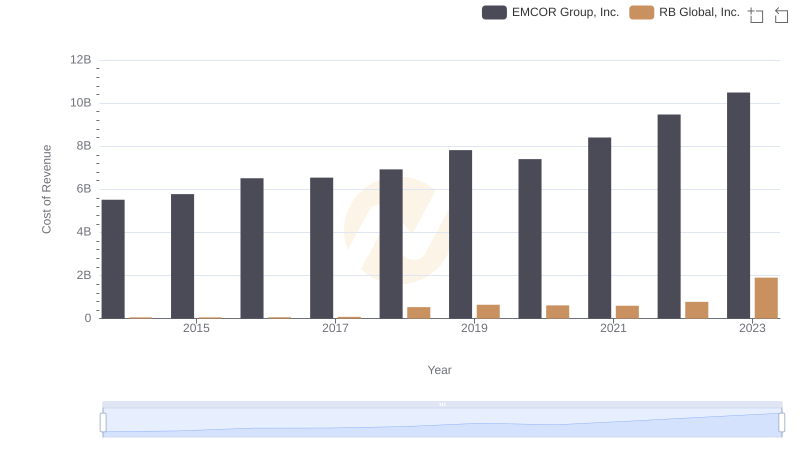
EMCOR Group, Inc. vs RB Global, Inc.: Efficiency in Cost of Revenue Explored
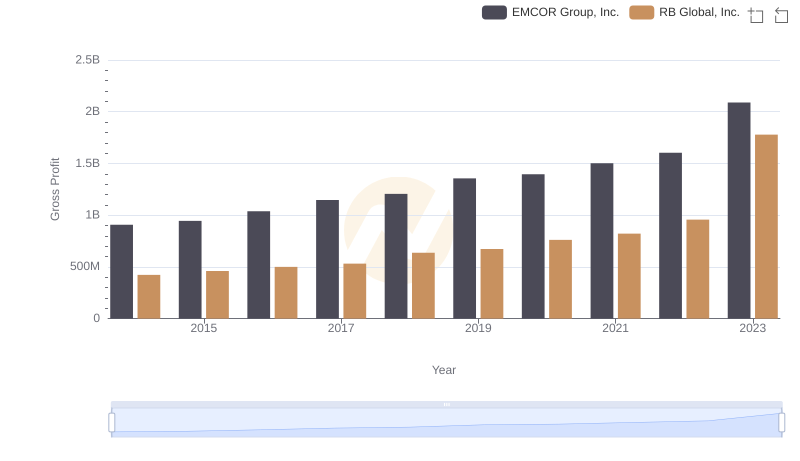
EMCOR Group, Inc. and RB Global, Inc.: A Detailed Gross Profit Analysis

Breaking Down SG&A Expenses: EMCOR Group, Inc. vs J.B. Hunt Transport Services, Inc.
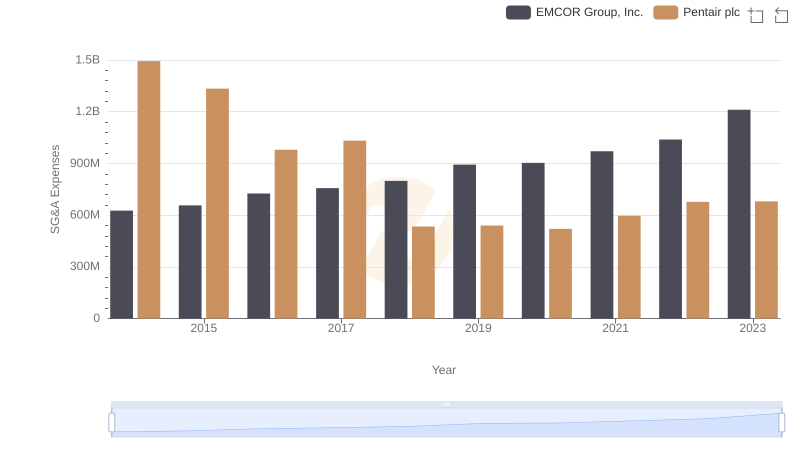
EMCOR Group, Inc. and Pentair plc: SG&A Spending Patterns Compared
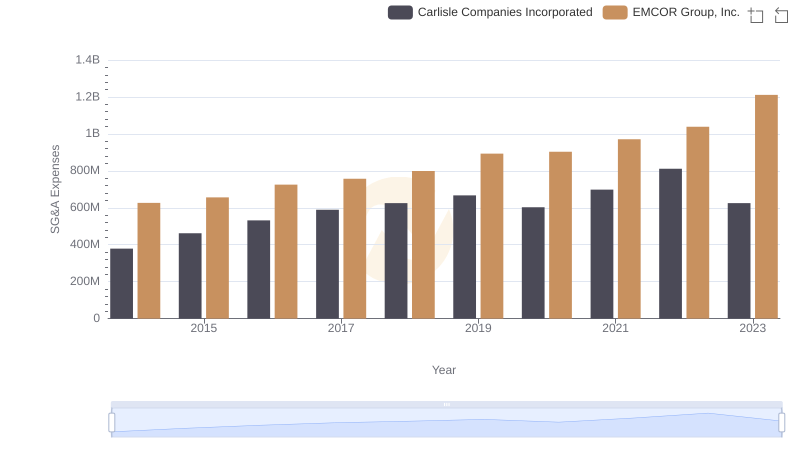
Breaking Down SG&A Expenses: EMCOR Group, Inc. vs Carlisle Companies Incorporated
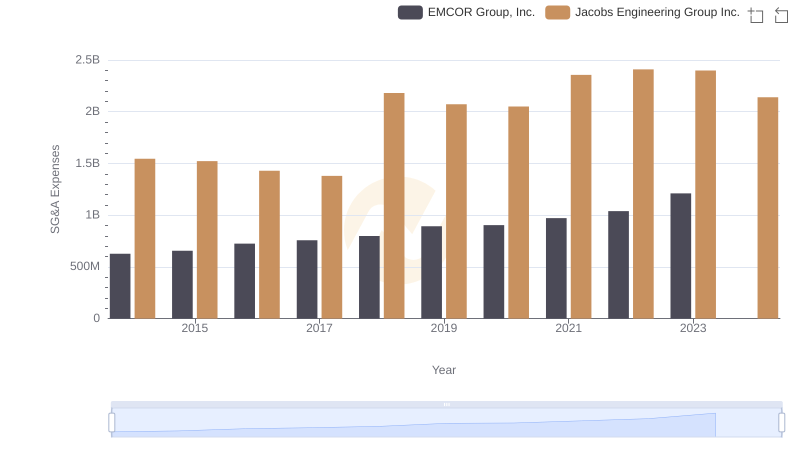
Selling, General, and Administrative Costs: EMCOR Group, Inc. vs Jacobs Engineering Group Inc.
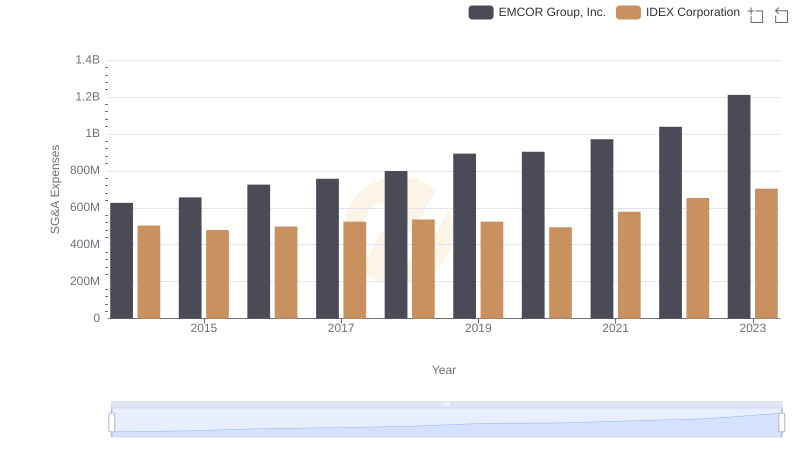
Breaking Down SG&A Expenses: EMCOR Group, Inc. vs IDEX Corporation
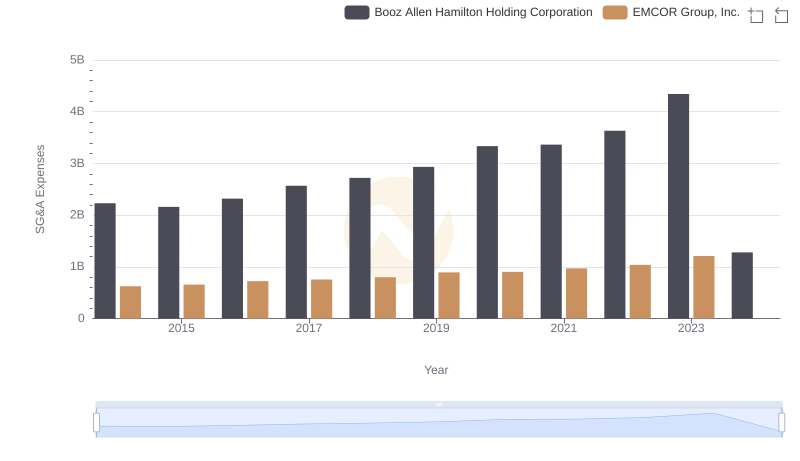
EMCOR Group, Inc. vs Booz Allen Hamilton Holding Corporation: SG&A Expense Trends
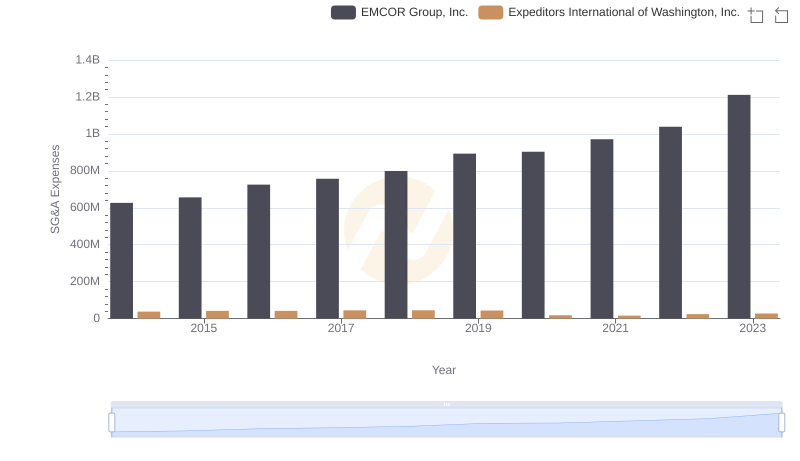
EMCOR Group, Inc. and Expeditors International of Washington, Inc.: SG&A Spending Patterns Compared