| __timestamp | EMCOR Group, Inc. | Pentair plc |
|---|---|---|
| Wednesday, January 1, 2014 | 626478000 | 1493800000 |
| Thursday, January 1, 2015 | 656573000 | 1334300000 |
| Friday, January 1, 2016 | 725538000 | 979300000 |
| Sunday, January 1, 2017 | 757062000 | 1032500000 |
| Monday, January 1, 2018 | 799157000 | 534300000 |
| Tuesday, January 1, 2019 | 893453000 | 540100000 |
| Wednesday, January 1, 2020 | 903584000 | 520500000 |
| Friday, January 1, 2021 | 970937000 | 596400000 |
| Saturday, January 1, 2022 | 1038717000 | 677100000 |
| Sunday, January 1, 2023 | 1211233000 | 680200000 |
| Monday, January 1, 2024 | 701400000 |
Unleashing insights
In the ever-evolving landscape of corporate finance, understanding the nuances of Selling, General, and Administrative (SG&A) expenses is crucial. Over the past decade, EMCOR Group, Inc. and Pentair plc have showcased distinct spending patterns in this domain. From 2014 to 2023, EMCOR's SG&A expenses surged by approximately 93%, reflecting a strategic expansion and operational scaling. In contrast, Pentair's SG&A expenses witnessed a significant decline of around 54%, indicating a shift towards leaner operations. This divergence highlights the contrasting business strategies of these industry giants. While EMCOR's upward trend suggests aggressive growth and investment, Pentair's reduction points to cost optimization and efficiency. As businesses navigate the complexities of the modern market, these insights offer a window into the strategic priorities shaping their financial landscapes.
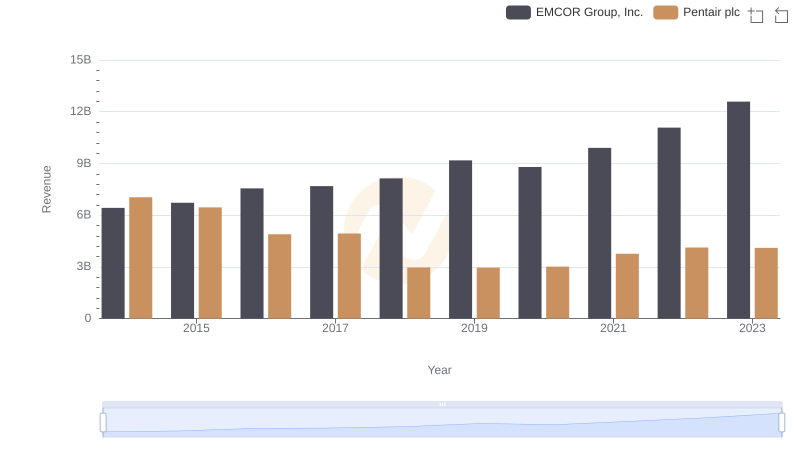
Revenue Insights: EMCOR Group, Inc. and Pentair plc Performance Compared

Breaking Down SG&A Expenses: EMCOR Group, Inc. vs J.B. Hunt Transport Services, Inc.
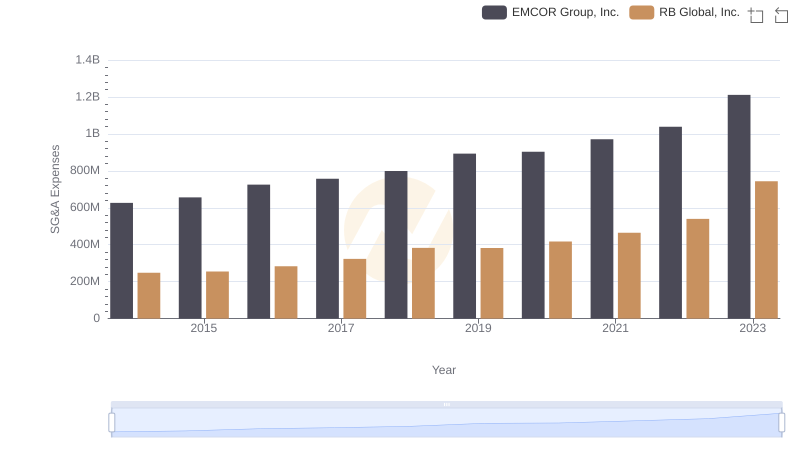
EMCOR Group, Inc. and RB Global, Inc.: SG&A Spending Patterns Compared
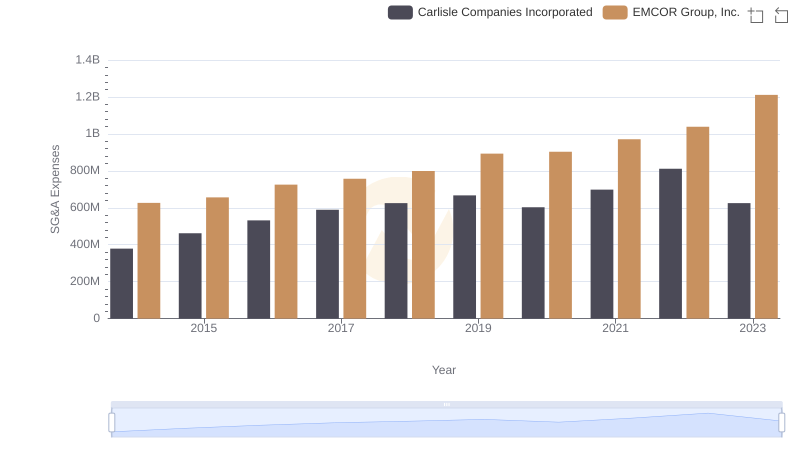
Breaking Down SG&A Expenses: EMCOR Group, Inc. vs Carlisle Companies Incorporated
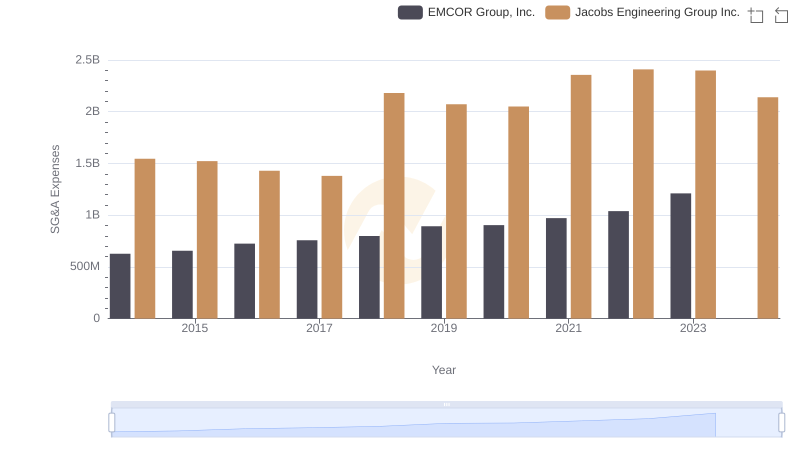
Selling, General, and Administrative Costs: EMCOR Group, Inc. vs Jacobs Engineering Group Inc.
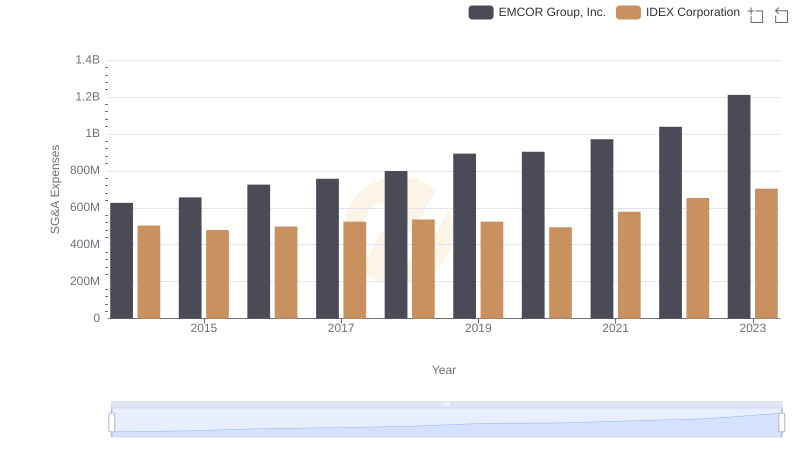
Breaking Down SG&A Expenses: EMCOR Group, Inc. vs IDEX Corporation
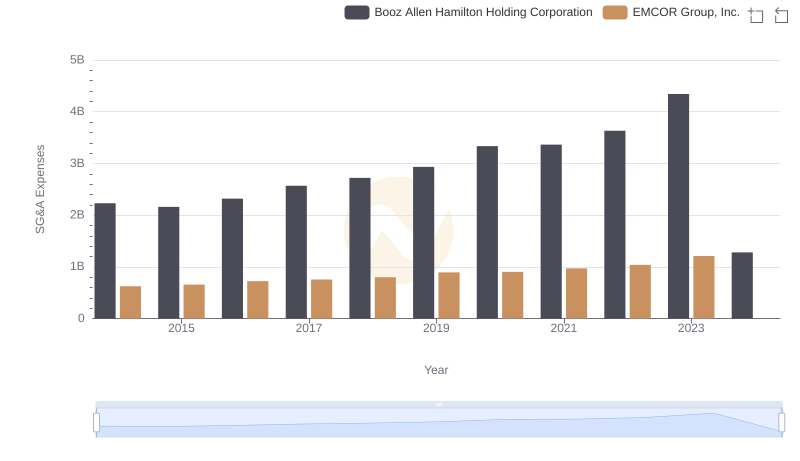
EMCOR Group, Inc. vs Booz Allen Hamilton Holding Corporation: SG&A Expense Trends
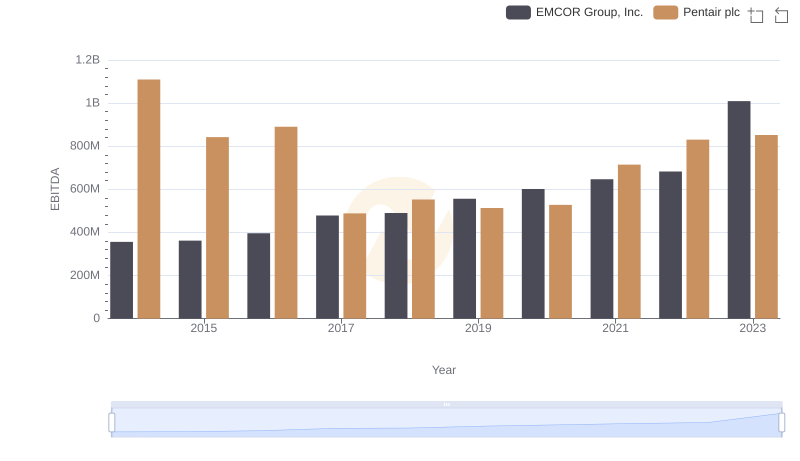
EBITDA Analysis: Evaluating EMCOR Group, Inc. Against Pentair plc
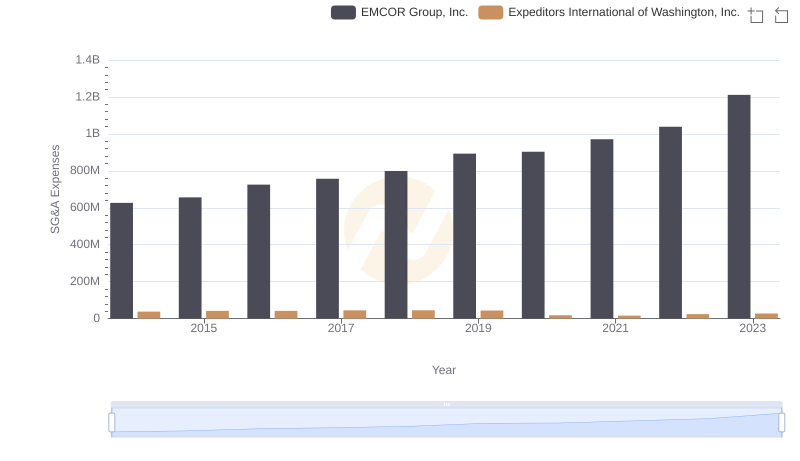
EMCOR Group, Inc. and Expeditors International of Washington, Inc.: SG&A Spending Patterns Compared