| __timestamp | AMETEK, Inc. | Rentokil Initial plc |
|---|---|---|
| Wednesday, January 1, 2014 | 1023344000 | 410400000 |
| Thursday, January 1, 2015 | 1093776000 | 408700000 |
| Friday, January 1, 2016 | 1007213000 | 489000000 |
| Sunday, January 1, 2017 | 1068174000 | 503200000 |
| Monday, January 1, 2018 | 1269415000 | 149800000 |
| Tuesday, January 1, 2019 | 1411422000 | 580600000 |
| Wednesday, January 1, 2020 | 1283159000 | 581000000 |
| Friday, January 1, 2021 | 1600782000 | 656000000 |
| Saturday, January 1, 2022 | 1820119000 | 767000000 |
| Sunday, January 1, 2023 | 2025843000 | 1157000000 |
| Monday, January 1, 2024 | 1779562000 |
Unleashing the power of data
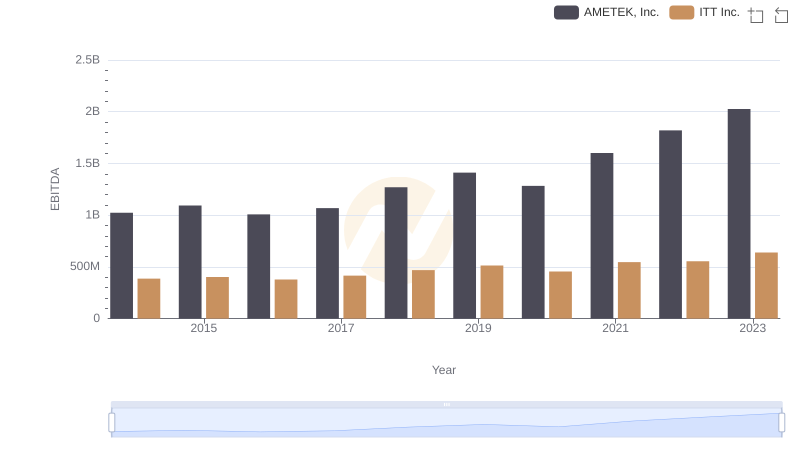
In the competitive landscape of industrial and service sectors, EBITDA serves as a crucial indicator of financial health and operational efficiency. Over the past decade, AMETEK, Inc. and Rentokil Initial plc have demonstrated contrasting trajectories in their EBITDA performance. From 2014 to 2023, AMETEK, Inc. has seen a robust growth of approximately 98%, with its EBITDA rising from around $1 billion to over $2 billion. This growth underscores AMETEK's strategic prowess in expanding its market footprint and optimizing operations.
Conversely, Rentokil Initial plc, while showing a commendable increase of about 182% in EBITDA, from $410 million to $1.16 billion, reflects its aggressive expansion and acquisition strategy. The year 2023 marks a significant milestone for Rentokil, achieving its highest EBITDA in the decade. This comparative analysis highlights the dynamic strategies employed by these industry leaders to enhance their financial performance.
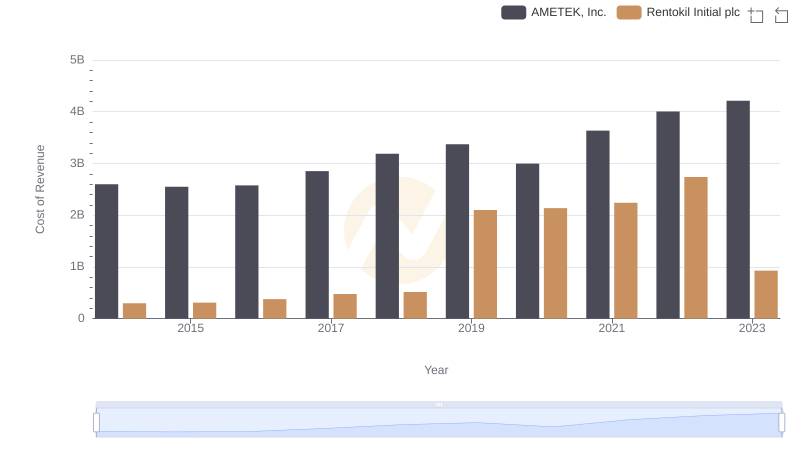
Cost Insights: Breaking Down AMETEK, Inc. and Rentokil Initial plc's Expenses
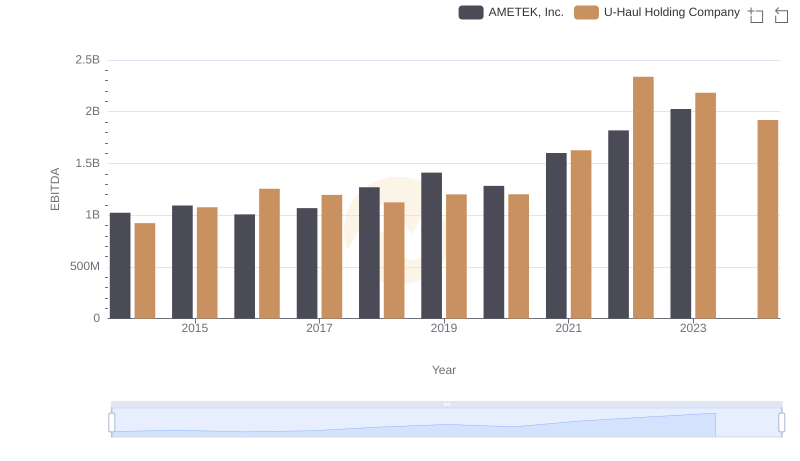
EBITDA Analysis: Evaluating AMETEK, Inc. Against U-Haul Holding Company
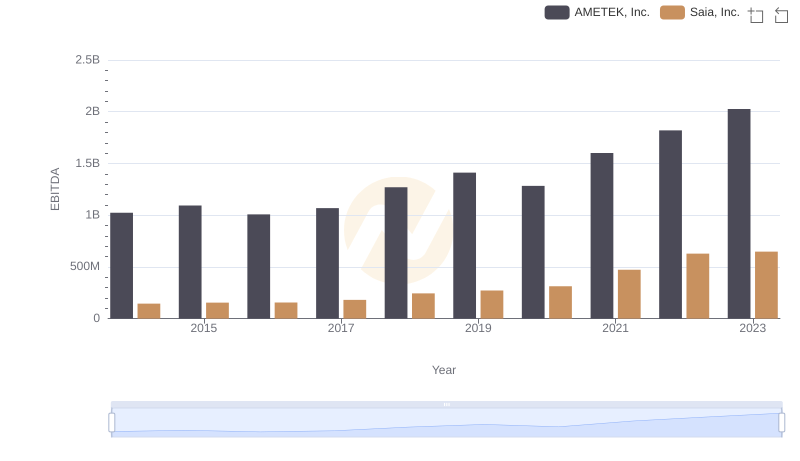
AMETEK, Inc. vs Saia, Inc.: In-Depth EBITDA Performance Comparison
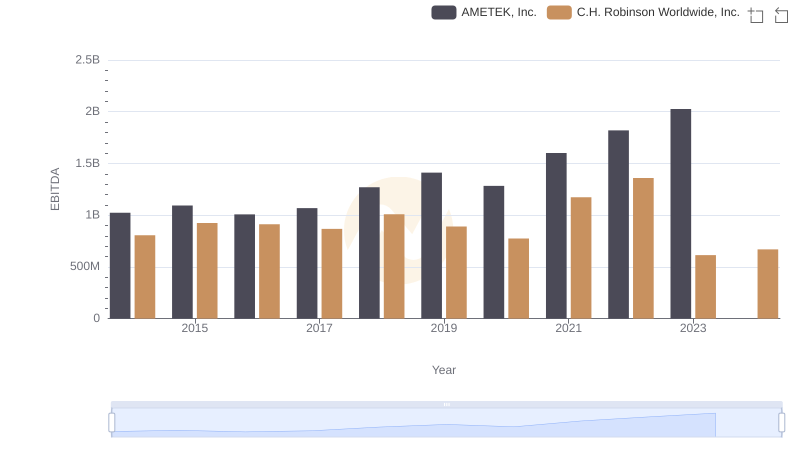
Professional EBITDA Benchmarking: AMETEK, Inc. vs C.H. Robinson Worldwide, Inc.
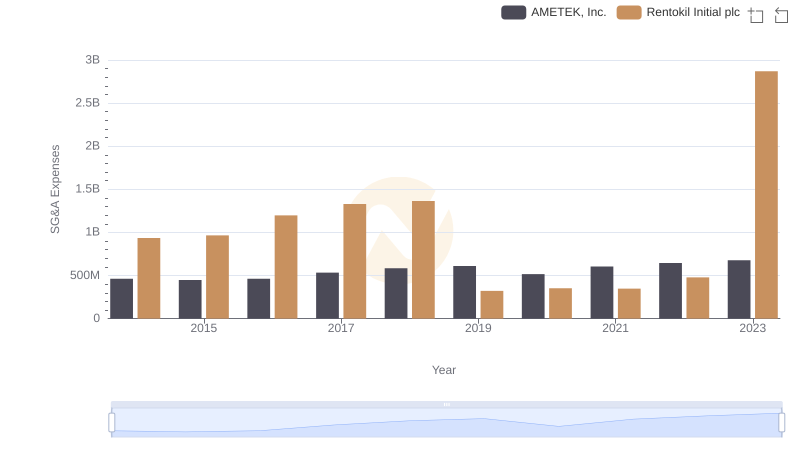
Selling, General, and Administrative Costs: AMETEK, Inc. vs Rentokil Initial plc
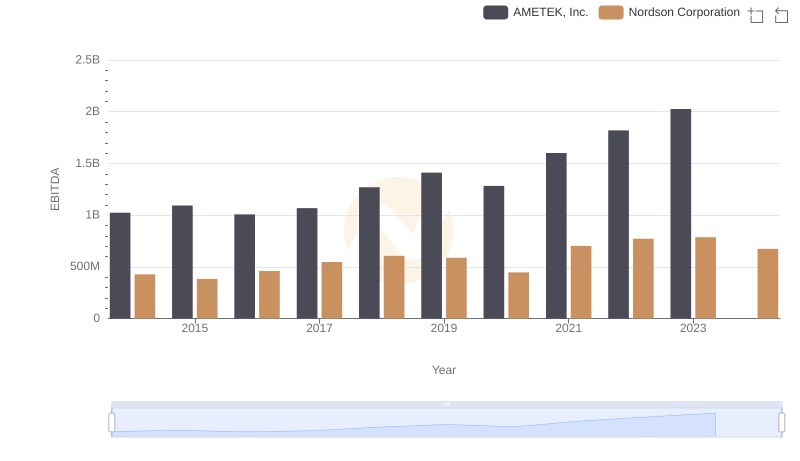
Comparative EBITDA Analysis: AMETEK, Inc. vs Nordson Corporation
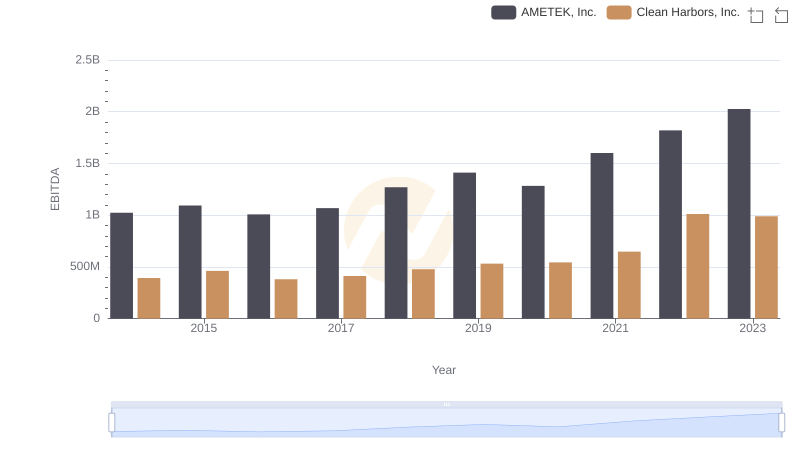
EBITDA Performance Review: AMETEK, Inc. vs Clean Harbors, Inc.
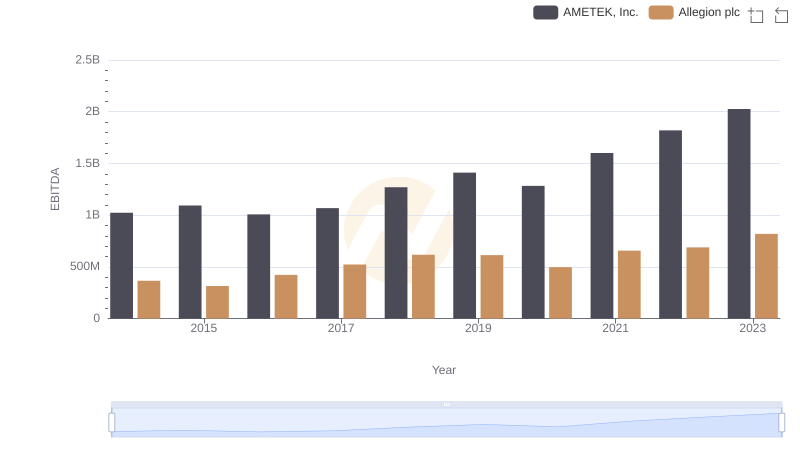
EBITDA Metrics Evaluated: AMETEK, Inc. vs Allegion plc
Comprehensive EBITDA Comparison: AMETEK, Inc. vs ITT Inc.