| __timestamp | RB Global, Inc. | Ryanair Holdings plc |
|---|---|---|
| Wednesday, January 1, 2014 | 57884000 | 3838100000 |
| Thursday, January 1, 2015 | 56026000 | 3999600000 |
| Friday, January 1, 2016 | 66062000 | 4355900000 |
| Sunday, January 1, 2017 | 79013000 | 4294000000 |
| Monday, January 1, 2018 | 533397000 | 4512300000 |
| Tuesday, January 1, 2019 | 645816000 | 5492800000 |
| Wednesday, January 1, 2020 | 615589000 | 6039900000 |
| Friday, January 1, 2021 | 594783000 | 1702700000 |
| Saturday, January 1, 2022 | 776701000 | 4009800000 |
| Sunday, January 1, 2023 | 1901200000 | 7735000000 |
| Monday, January 1, 2024 | 0 | 9566400000 |
Data in motion
In the competitive landscape of global business, cost efficiency is a critical metric for success. This analysis delves into the cost of revenue trends for Ryanair Holdings plc and RB Global, Inc. from 2014 to 2023. Ryanair, a leader in the airline industry, consistently demonstrates a robust cost management strategy, with its cost of revenue peaking at approximately €9.6 billion in 2024, reflecting a 150% increase from 2014. In contrast, RB Global, Inc., a key player in the auction industry, shows a more modest growth, with its cost of revenue reaching around $1.9 billion in 2023, a significant leap from its 2014 figures. This comparison highlights Ryanair's aggressive expansion and cost control measures, while RB Global's steady growth underscores its strategic positioning in a niche market. Missing data for 2024 in RB Global's figures suggests potential volatility or strategic shifts.
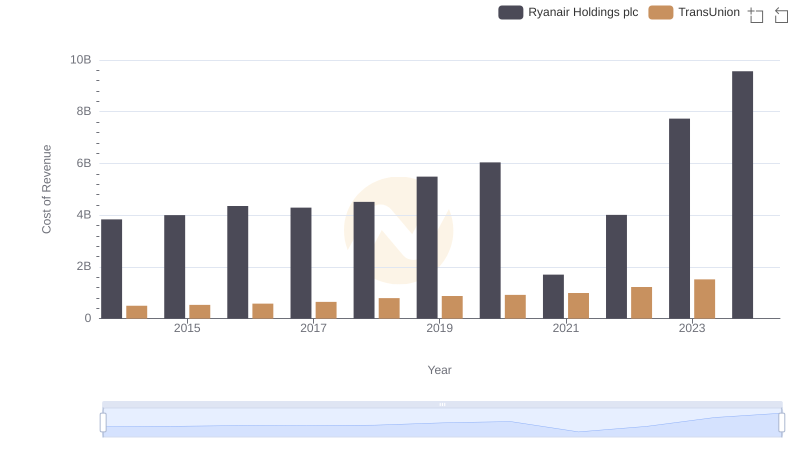
Ryanair Holdings plc vs TransUnion: Efficiency in Cost of Revenue Explored
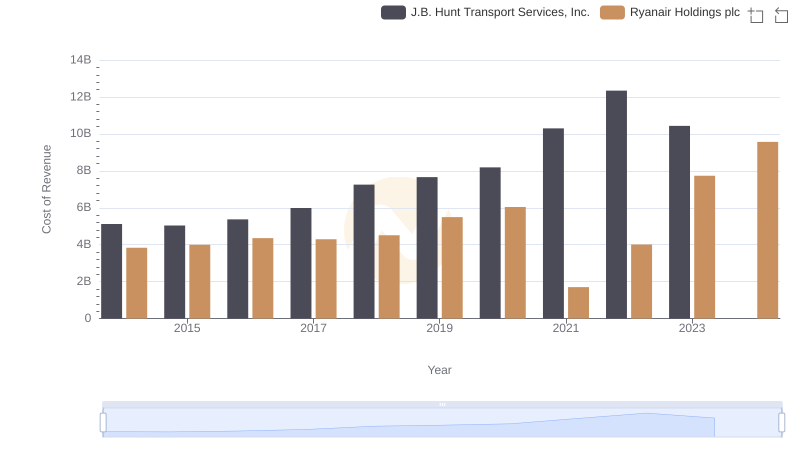
Ryanair Holdings plc vs J.B. Hunt Transport Services, Inc.: Efficiency in Cost of Revenue Explored
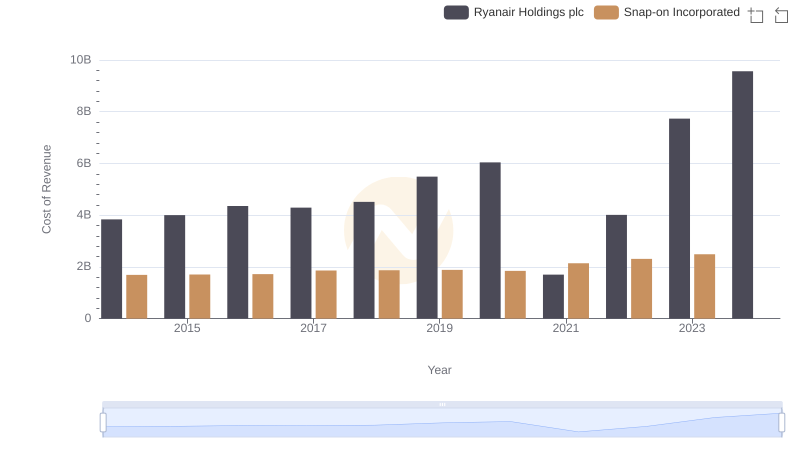
Comparing Cost of Revenue Efficiency: Ryanair Holdings plc vs Snap-on Incorporated
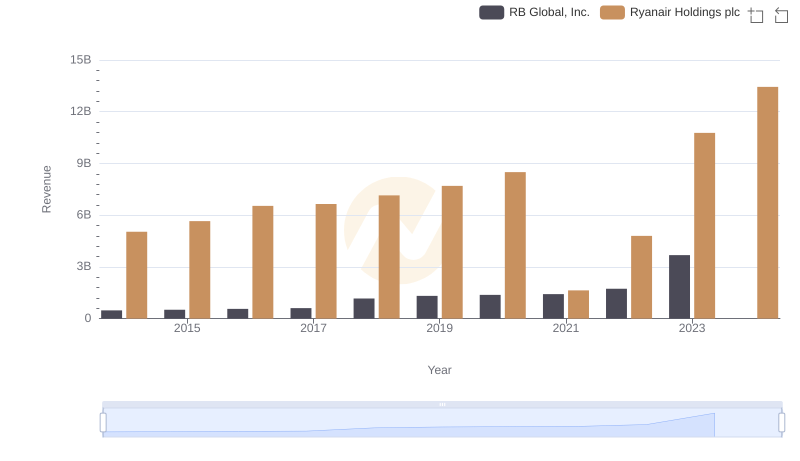
Comparing Revenue Performance: Ryanair Holdings plc or RB Global, Inc.?
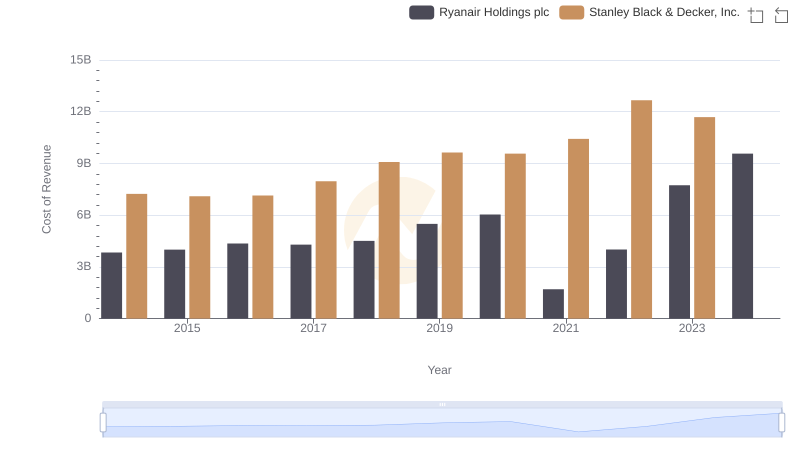
Cost of Revenue Trends: Ryanair Holdings plc vs Stanley Black & Decker, Inc.
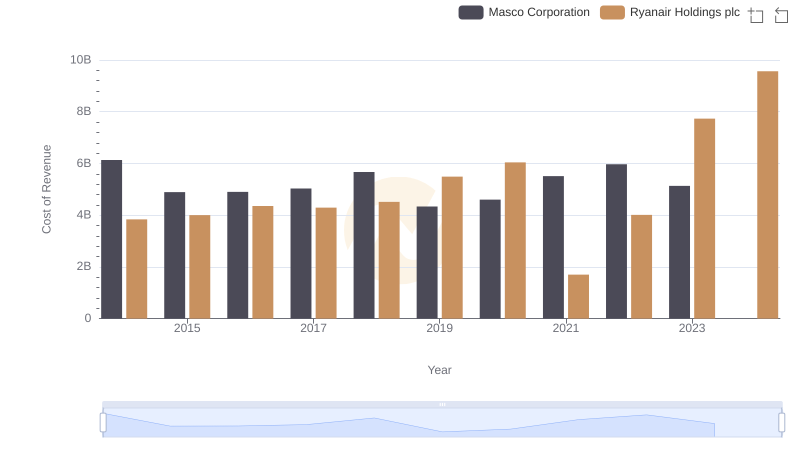
Cost of Revenue Trends: Ryanair Holdings plc vs Masco Corporation
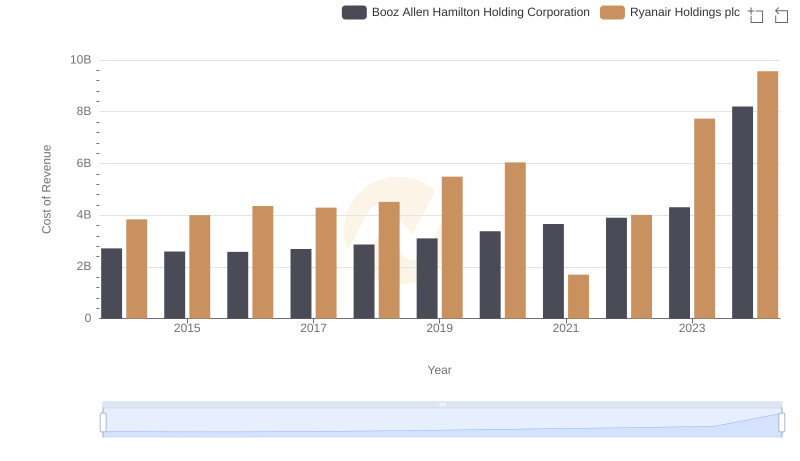
Comparing Cost of Revenue Efficiency: Ryanair Holdings plc vs Booz Allen Hamilton Holding Corporation
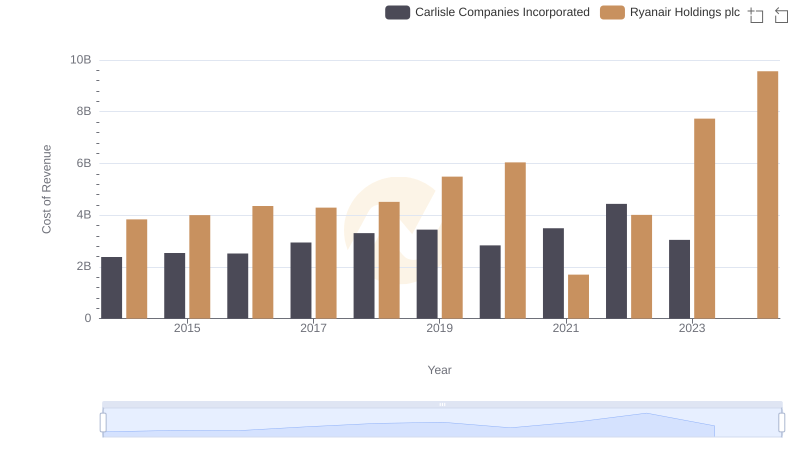
Cost of Revenue Comparison: Ryanair Holdings plc vs Carlisle Companies Incorporated
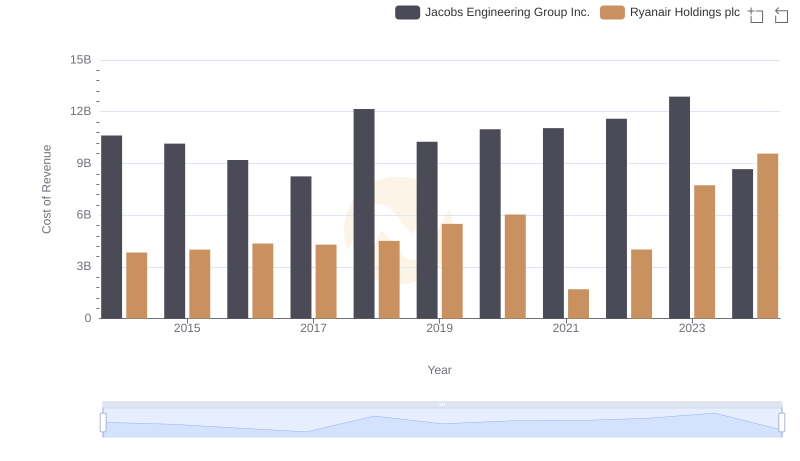
Cost of Revenue: Key Insights for Ryanair Holdings plc and Jacobs Engineering Group Inc.
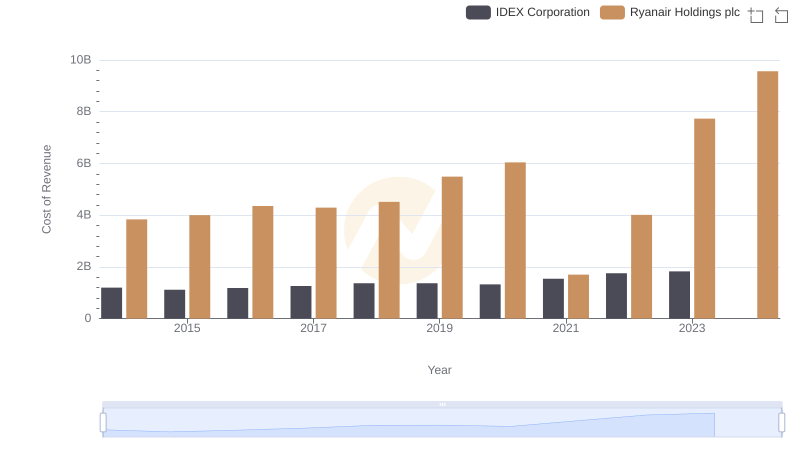
Cost of Revenue Comparison: Ryanair Holdings plc vs IDEX Corporation
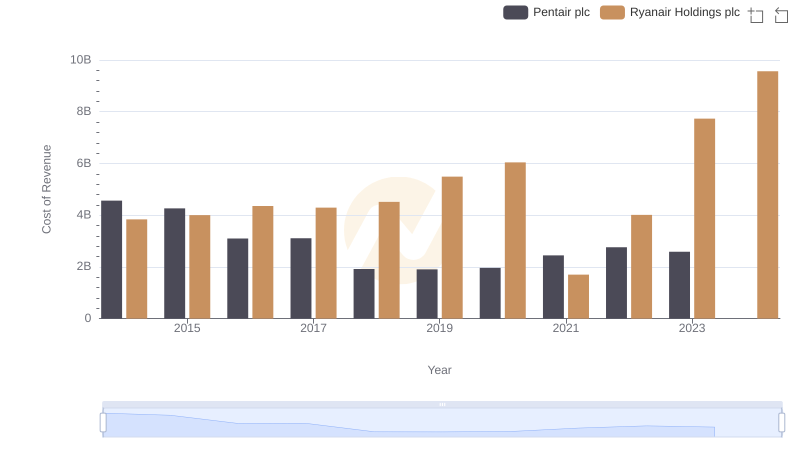
Cost of Revenue Comparison: Ryanair Holdings plc vs Pentair plc
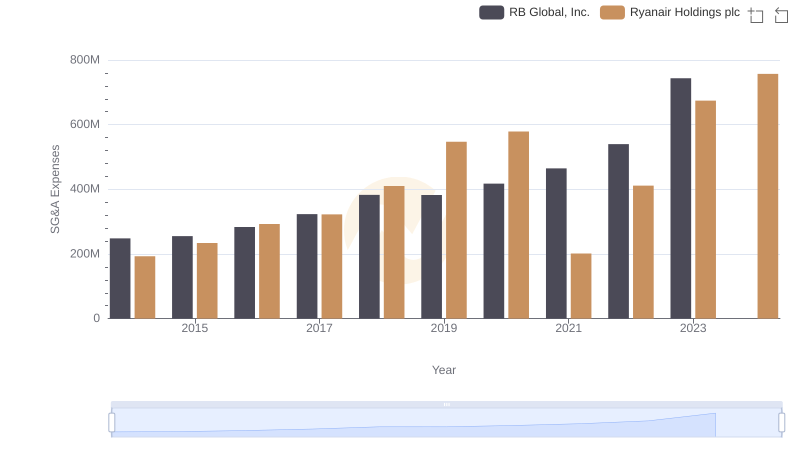
Comparing SG&A Expenses: Ryanair Holdings plc vs RB Global, Inc. Trends and Insights