| __timestamp | Jacobs Engineering Group Inc. | Ryanair Holdings plc |
|---|---|---|
| Wednesday, January 1, 2014 | 10621373000 | 3838100000 |
| Thursday, January 1, 2015 | 10146494000 | 3999600000 |
| Friday, January 1, 2016 | 9196326000 | 4355900000 |
| Sunday, January 1, 2017 | 8250536000 | 4294000000 |
| Monday, January 1, 2018 | 12156276000 | 4512300000 |
| Tuesday, January 1, 2019 | 10260840000 | 5492800000 |
| Wednesday, January 1, 2020 | 10980307000 | 6039900000 |
| Friday, January 1, 2021 | 11048860000 | 1702700000 |
| Saturday, January 1, 2022 | 11595785000 | 4009800000 |
| Sunday, January 1, 2023 | 12879099000 | 7735000000 |
| Monday, January 1, 2024 | 8668185000 | 9566400000 |
Infusing magic into the data realm
In the ever-evolving landscape of global business, understanding cost structures is crucial. This analysis delves into the cost of revenue trends for Ryanair Holdings plc and Jacobs Engineering Group Inc. over the past decade.
From 2014 to 2024, Jacobs Engineering Group Inc. consistently maintained a higher cost of revenue, peaking in 2023 with a 21% increase from its 2014 figures. Meanwhile, Ryanair Holdings plc showcased a more volatile pattern, with a significant dip in 2021, followed by a robust recovery, culminating in a 150% surge by 2024.
These insights reveal the strategic financial maneuvers of both companies, highlighting Jacobs' steady growth and Ryanair's resilience in the face of economic challenges. As businesses navigate the complexities of the modern market, such data-driven insights are invaluable for stakeholders and investors alike.
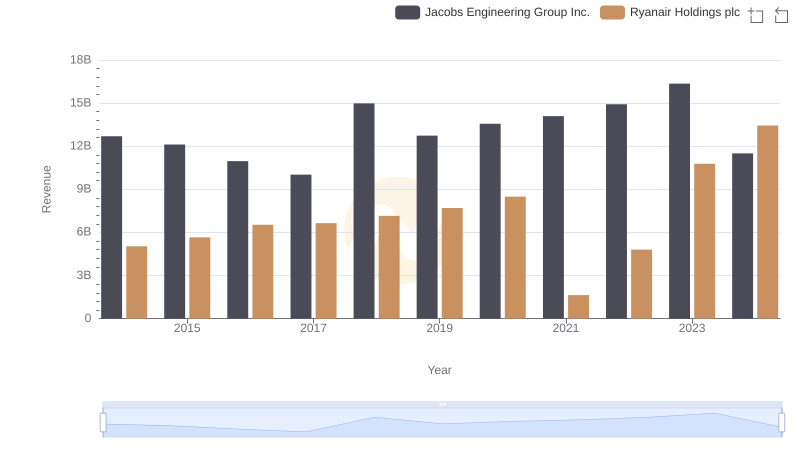
Who Generates More Revenue? Ryanair Holdings plc or Jacobs Engineering Group Inc.
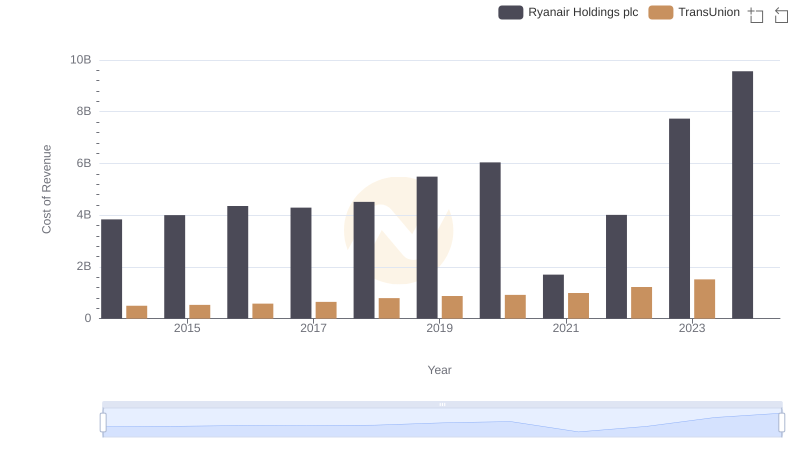
Ryanair Holdings plc vs TransUnion: Efficiency in Cost of Revenue Explored
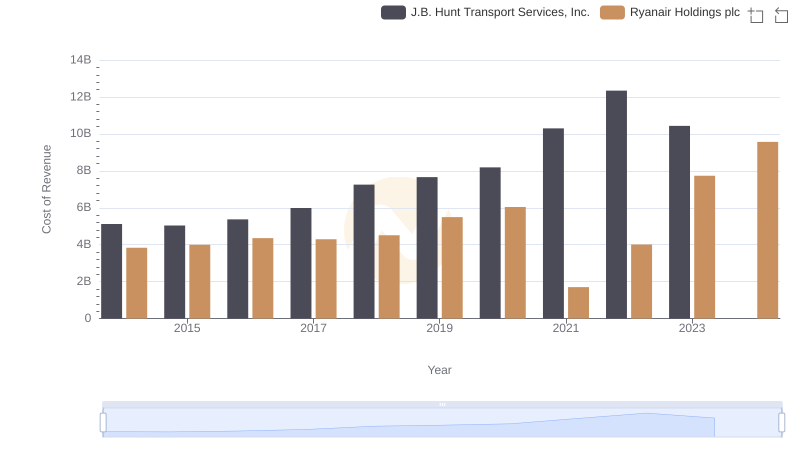
Ryanair Holdings plc vs J.B. Hunt Transport Services, Inc.: Efficiency in Cost of Revenue Explored
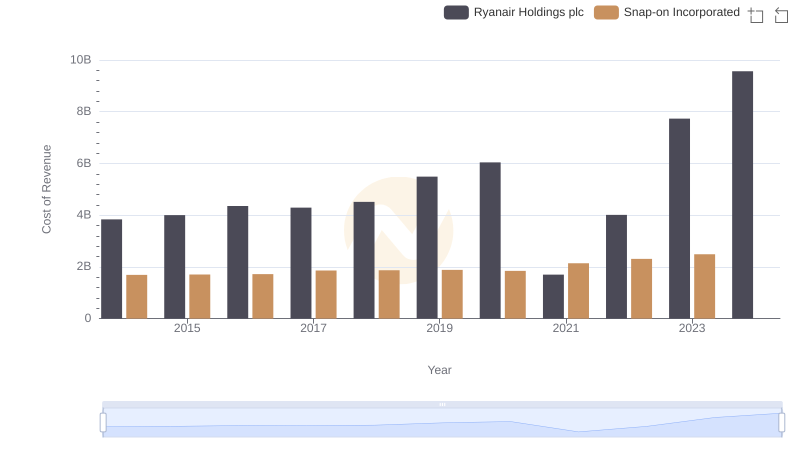
Comparing Cost of Revenue Efficiency: Ryanair Holdings plc vs Snap-on Incorporated
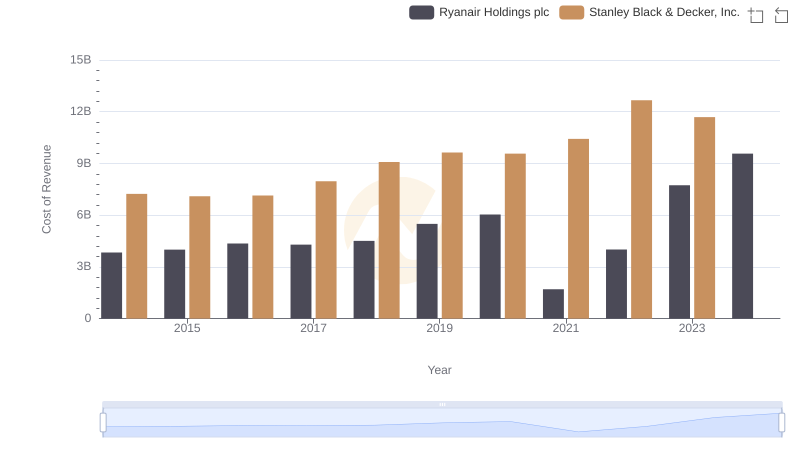
Cost of Revenue Trends: Ryanair Holdings plc vs Stanley Black & Decker, Inc.
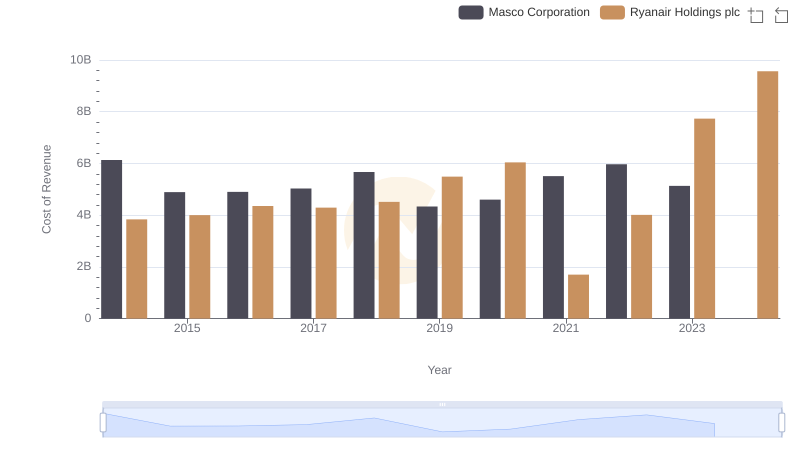
Cost of Revenue Trends: Ryanair Holdings plc vs Masco Corporation
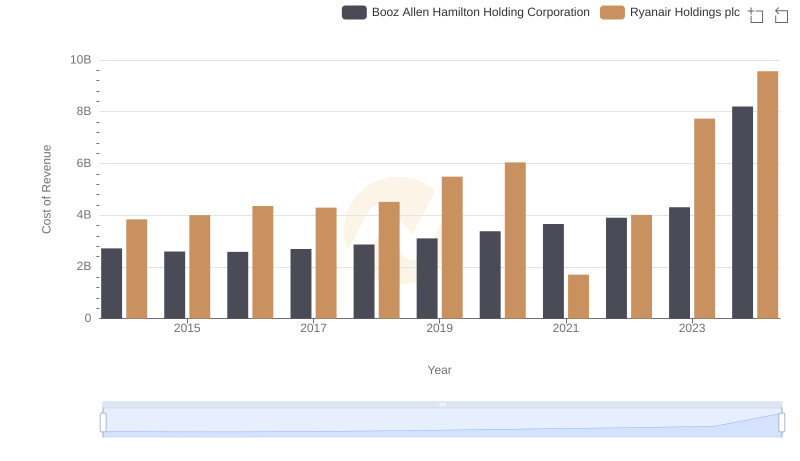
Comparing Cost of Revenue Efficiency: Ryanair Holdings plc vs Booz Allen Hamilton Holding Corporation
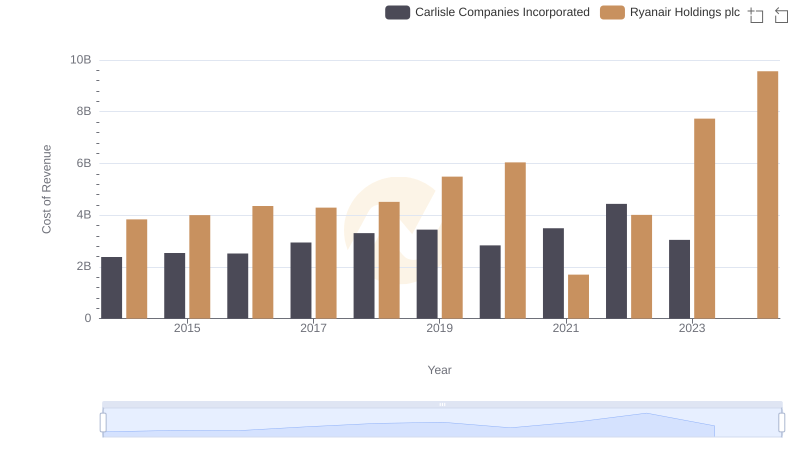
Cost of Revenue Comparison: Ryanair Holdings plc vs Carlisle Companies Incorporated
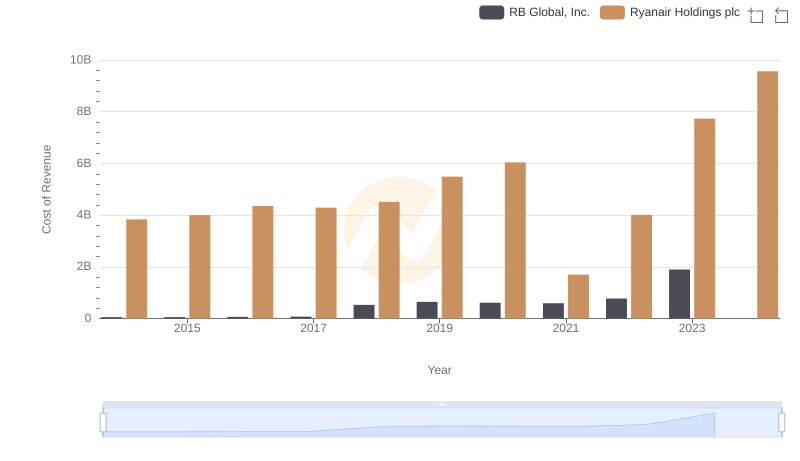
Ryanair Holdings plc vs RB Global, Inc.: Efficiency in Cost of Revenue Explored
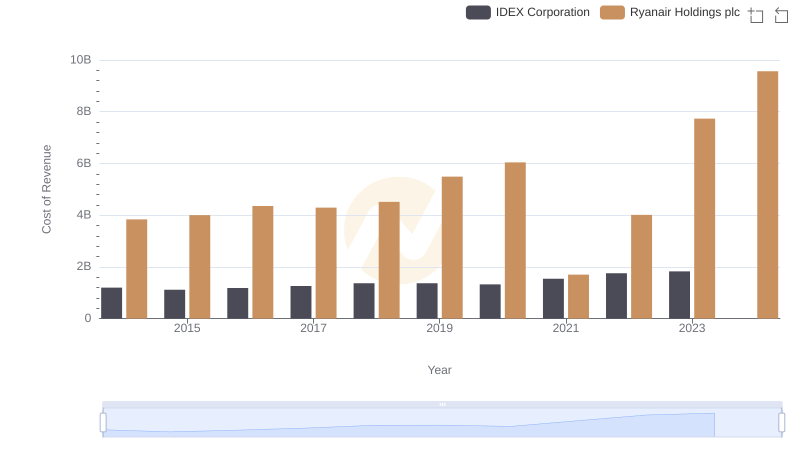
Cost of Revenue Comparison: Ryanair Holdings plc vs IDEX Corporation
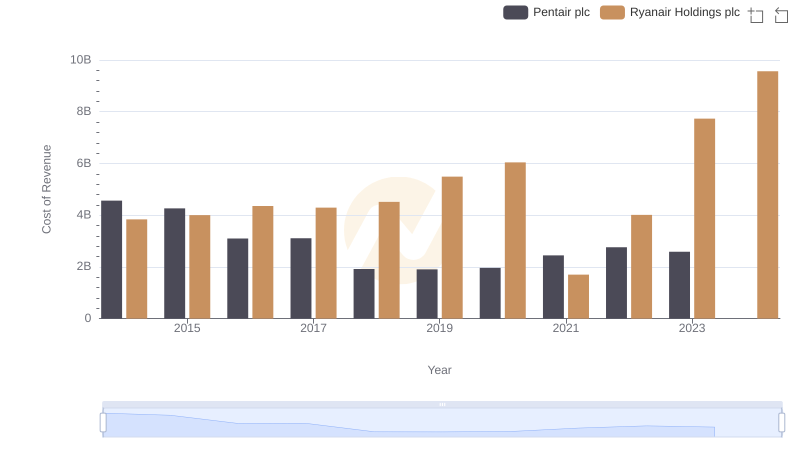
Cost of Revenue Comparison: Ryanair Holdings plc vs Pentair plc
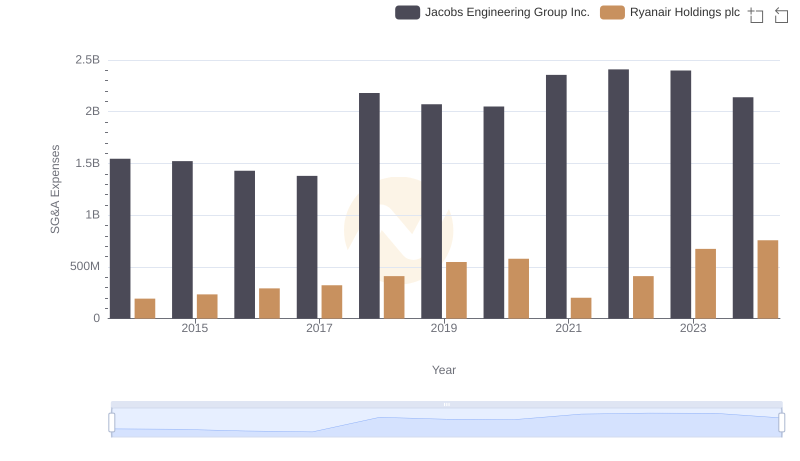
Who Optimizes SG&A Costs Better? Ryanair Holdings plc or Jacobs Engineering Group Inc.