| __timestamp | RB Global, Inc. | Ryanair Holdings plc |
|---|---|---|
| Wednesday, January 1, 2014 | 248220000 | 192800000 |
| Thursday, January 1, 2015 | 254990000 | 233900000 |
| Friday, January 1, 2016 | 283529000 | 292700000 |
| Sunday, January 1, 2017 | 323270000 | 322300000 |
| Monday, January 1, 2018 | 382676000 | 410400000 |
| Tuesday, January 1, 2019 | 382389000 | 547300000 |
| Wednesday, January 1, 2020 | 417523000 | 578800000 |
| Friday, January 1, 2021 | 464599000 | 201500000 |
| Saturday, January 1, 2022 | 539933000 | 411300000 |
| Sunday, January 1, 2023 | 743700000 | 674400000 |
| Monday, January 1, 2024 | 773900000 | 757200000 |
Data in motion
Over the past decade, the Selling, General, and Administrative (SG&A) expenses of Ryanair Holdings plc and RB Global, Inc. have shown intriguing trends. From 2014 to 2023, Ryanair's SG&A expenses surged by approximately 250%, peaking in 2023. In contrast, RB Global's expenses increased by nearly 200% over the same period, with a notable spike in 2023.
These trends highlight the dynamic nature of SG&A expenses, reflecting strategic shifts and market conditions. Missing data for 2024 suggests ongoing developments worth monitoring.
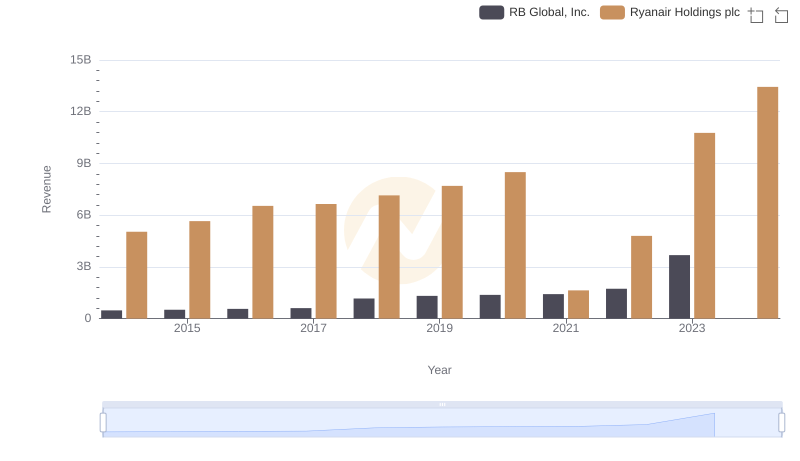
Comparing Revenue Performance: Ryanair Holdings plc or RB Global, Inc.?
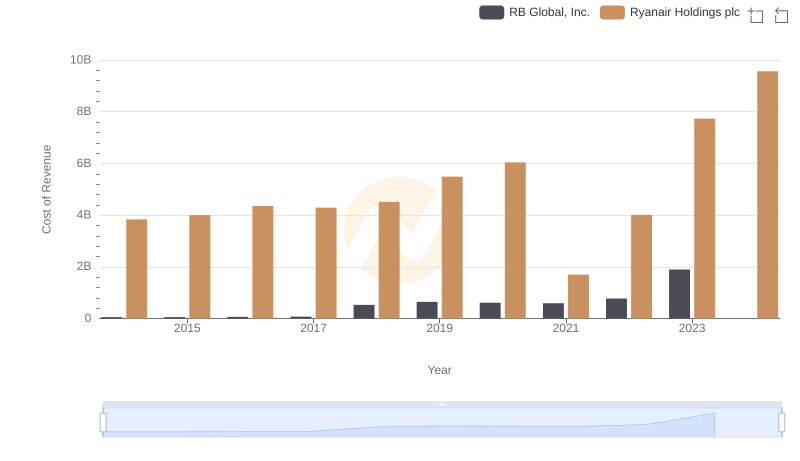
Ryanair Holdings plc vs RB Global, Inc.: Efficiency in Cost of Revenue Explored
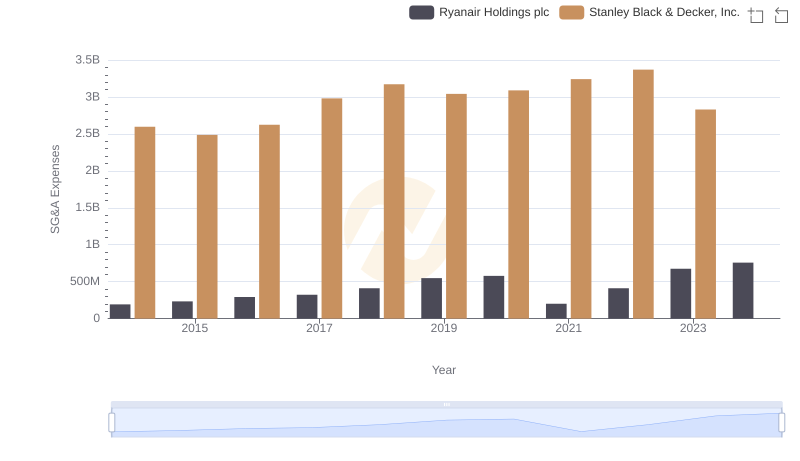
Operational Costs Compared: SG&A Analysis of Ryanair Holdings plc and Stanley Black & Decker, Inc.
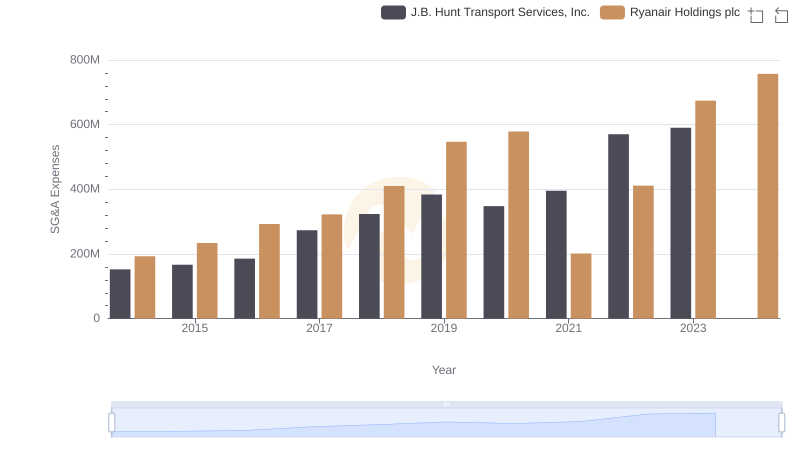
Selling, General, and Administrative Costs: Ryanair Holdings plc vs J.B. Hunt Transport Services, Inc.
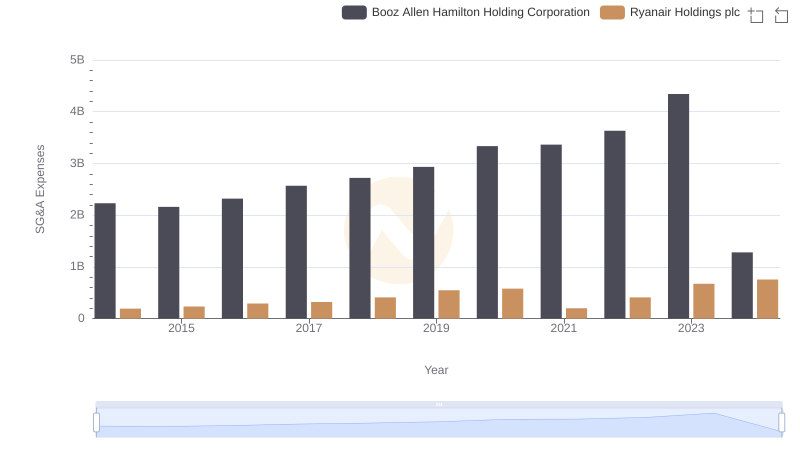
Cost Management Insights: SG&A Expenses for Ryanair Holdings plc and Booz Allen Hamilton Holding Corporation
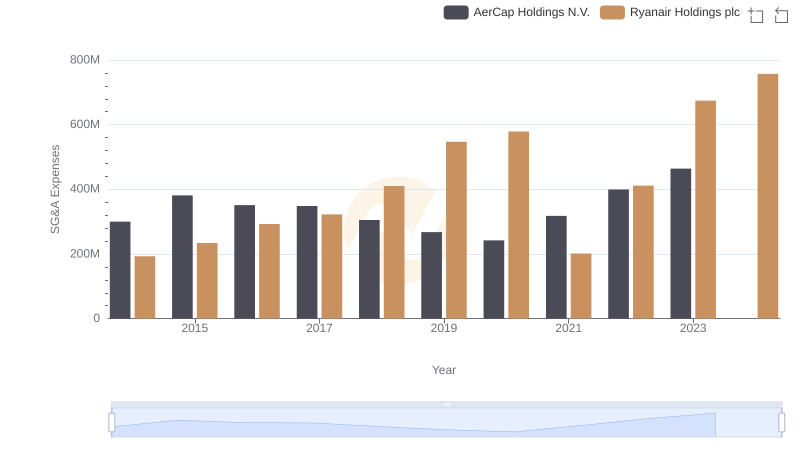
Ryanair Holdings plc and AerCap Holdings N.V.: SG&A Spending Patterns Compared
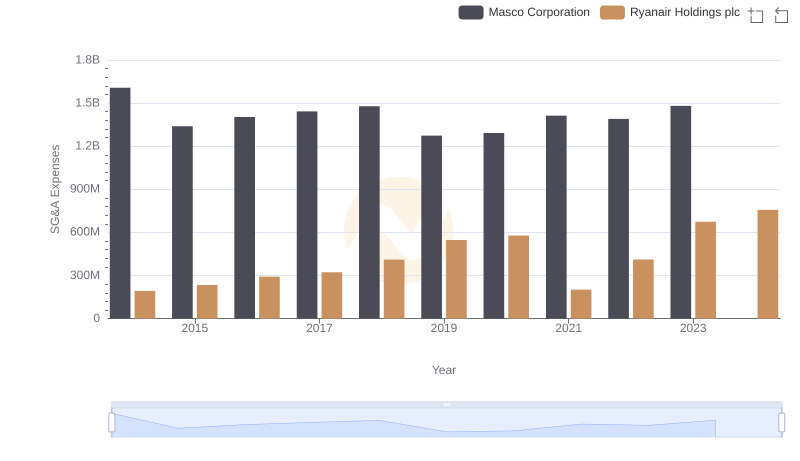
Cost Management Insights: SG&A Expenses for Ryanair Holdings plc and Masco Corporation
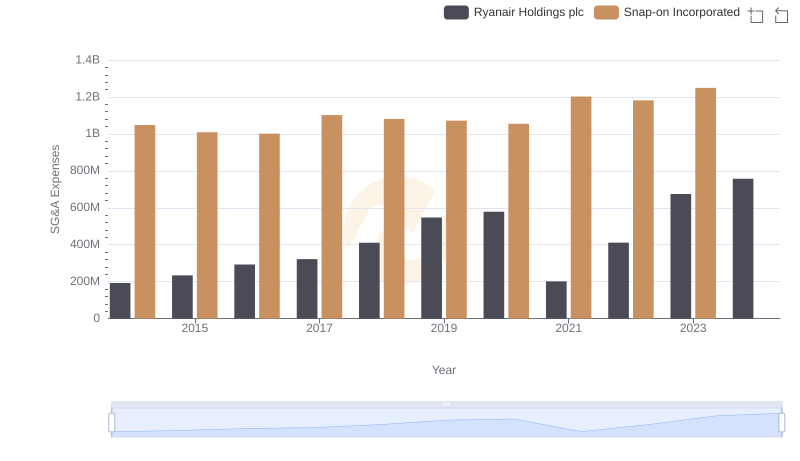
Comparing SG&A Expenses: Ryanair Holdings plc vs Snap-on Incorporated Trends and Insights
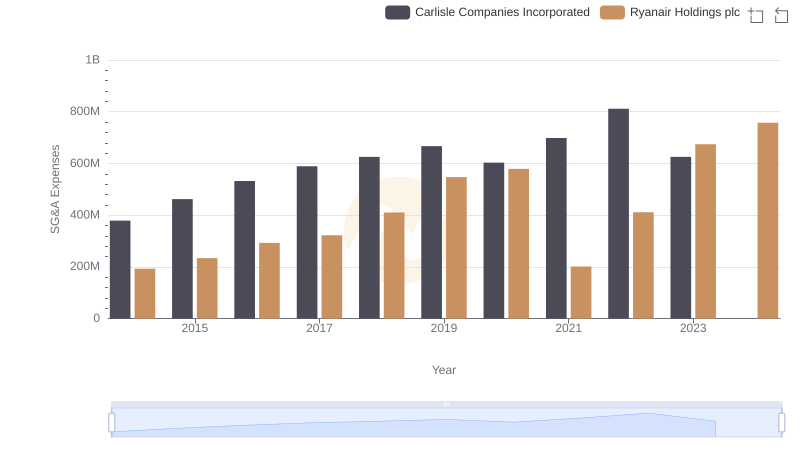
Selling, General, and Administrative Costs: Ryanair Holdings plc vs Carlisle Companies Incorporated
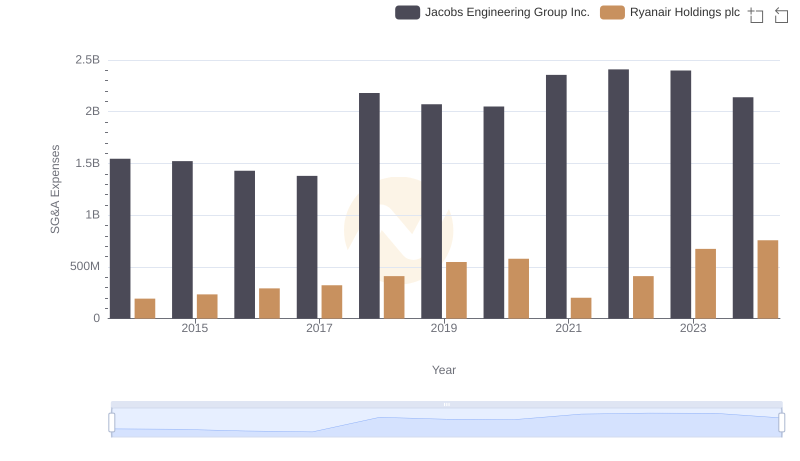
Who Optimizes SG&A Costs Better? Ryanair Holdings plc or Jacobs Engineering Group Inc.
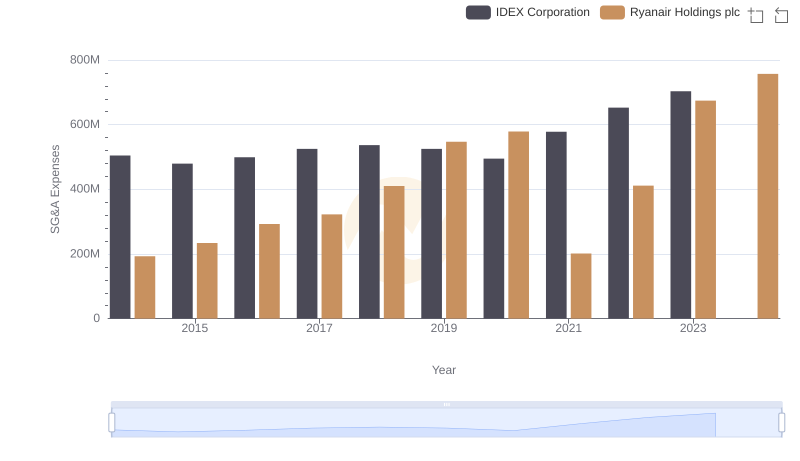
Ryanair Holdings plc and IDEX Corporation: SG&A Spending Patterns Compared
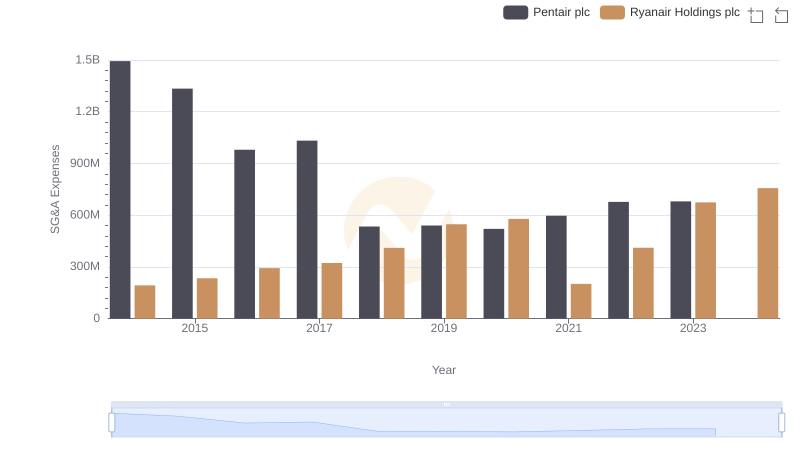
Ryanair Holdings plc and Pentair plc: SG&A Spending Patterns Compared