| __timestamp | Owens Corning | Ryanair Holdings plc |
|---|---|---|
| Wednesday, January 1, 2014 | 4300000000 | 3838100000 |
| Thursday, January 1, 2015 | 4197000000 | 3999600000 |
| Friday, January 1, 2016 | 4296000000 | 4355900000 |
| Sunday, January 1, 2017 | 4812000000 | 4294000000 |
| Monday, January 1, 2018 | 5425000000 | 4512300000 |
| Tuesday, January 1, 2019 | 5551000000 | 5492800000 |
| Wednesday, January 1, 2020 | 5445000000 | 6039900000 |
| Friday, January 1, 2021 | 6281000000 | 1702700000 |
| Saturday, January 1, 2022 | 7145000000 | 4009800000 |
| Sunday, January 1, 2023 | 6994000000 | 7735000000 |
| Monday, January 1, 2024 | 9566400000 |
Cracking the code
In the ever-evolving landscape of global business, cost efficiency remains a pivotal factor for success. This analysis delves into the cost of revenue trends for Ryanair Holdings plc and Owens Corning from 2014 to 2023. Ryanair, a leader in the aviation industry, showcases a remarkable 102% increase in its cost of revenue from 2014 to 2023, peaking at approximately $7.7 billion in 2023. Meanwhile, Owens Corning, a stalwart in the building materials sector, experienced a 63% rise, reaching around $7.1 billion in 2022. Notably, 2021 marked a significant dip for Ryanair, with costs plummeting to $1.7 billion, reflecting the pandemic's impact. As we look to the future, the absence of data for Owens Corning in 2024 leaves room for speculation. This comparative analysis underscores the dynamic nature of cost management across industries, offering valuable insights for investors and stakeholders.
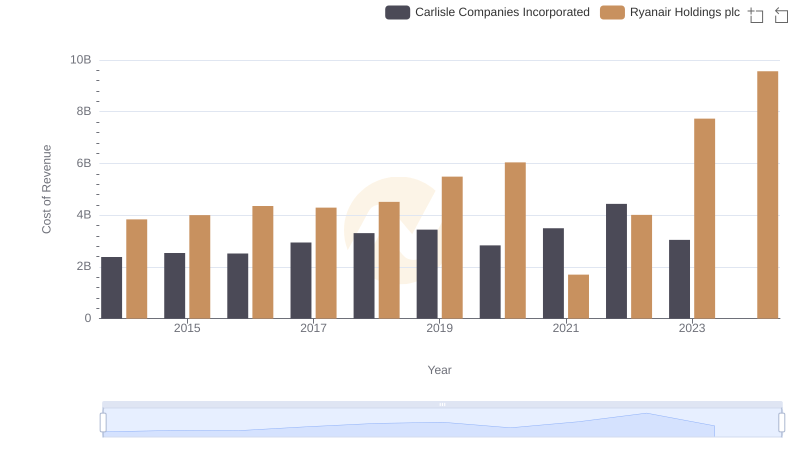
Cost of Revenue Comparison: Ryanair Holdings plc vs Carlisle Companies Incorporated
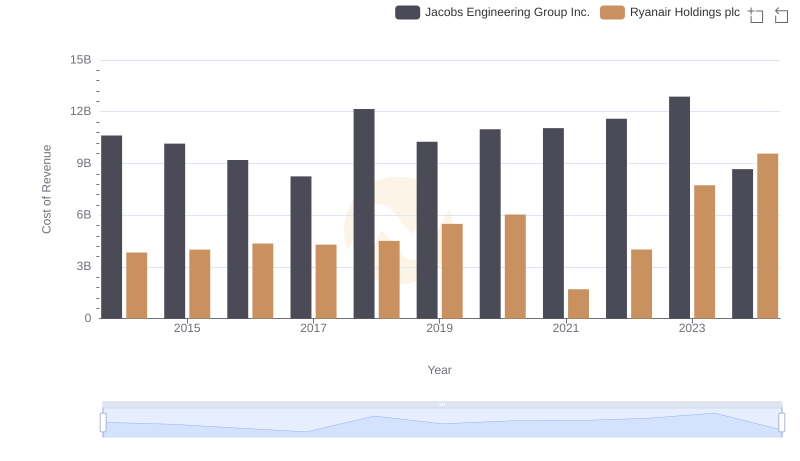
Cost of Revenue: Key Insights for Ryanair Holdings plc and Jacobs Engineering Group Inc.
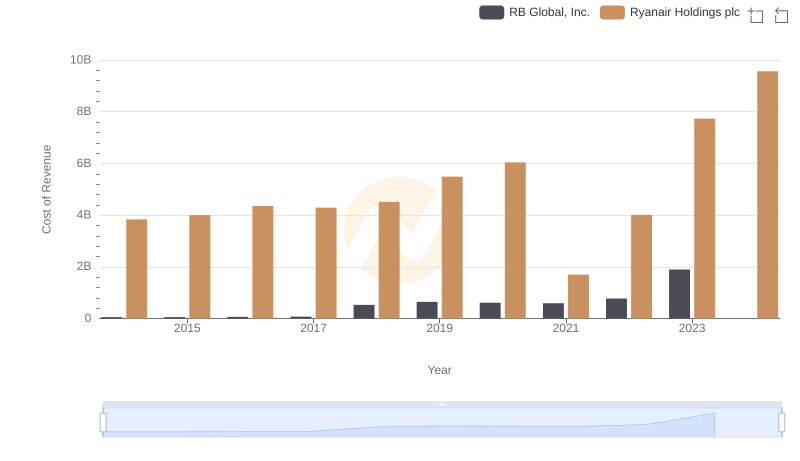
Ryanair Holdings plc vs RB Global, Inc.: Efficiency in Cost of Revenue Explored
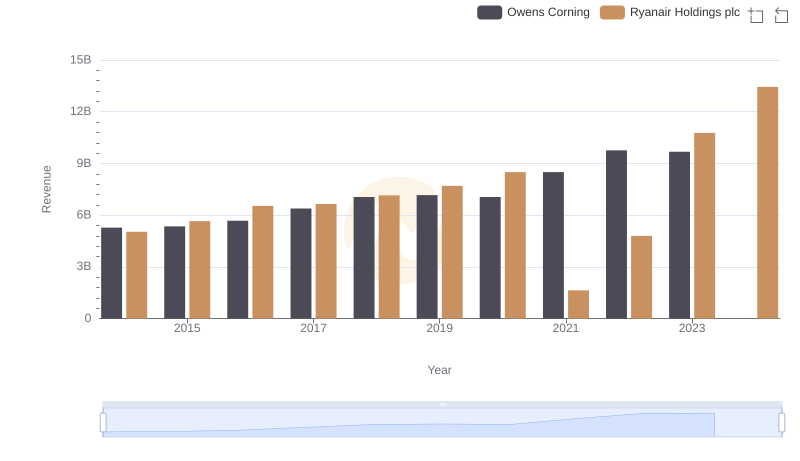
Revenue Showdown: Ryanair Holdings plc vs Owens Corning
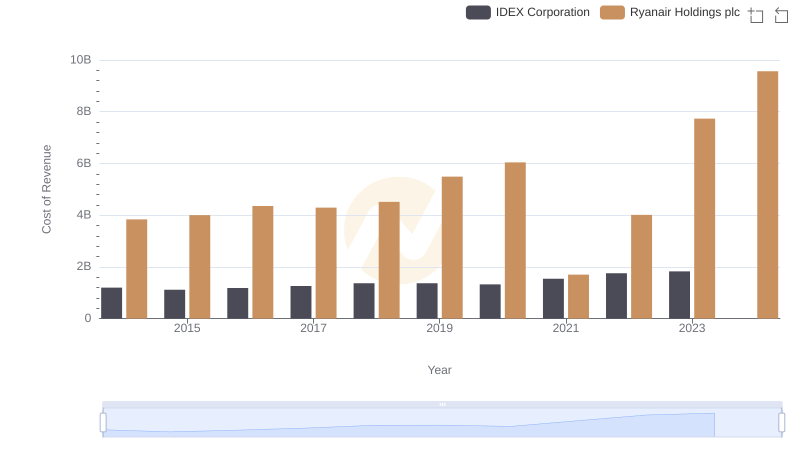
Cost of Revenue Comparison: Ryanair Holdings plc vs IDEX Corporation
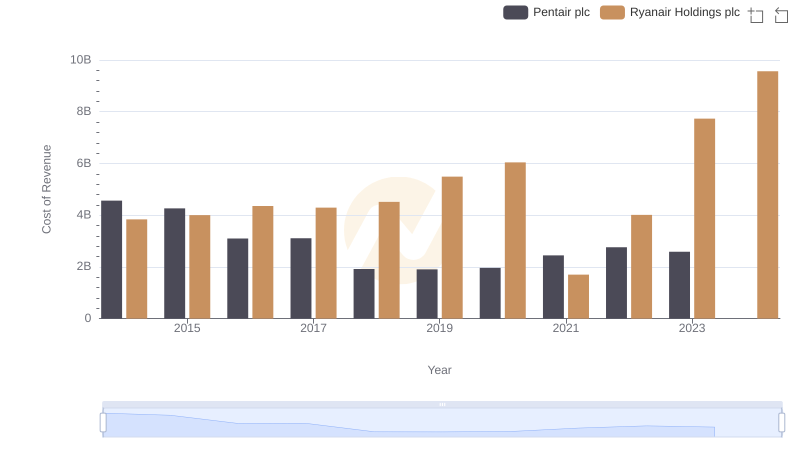
Cost of Revenue Comparison: Ryanair Holdings plc vs Pentair plc
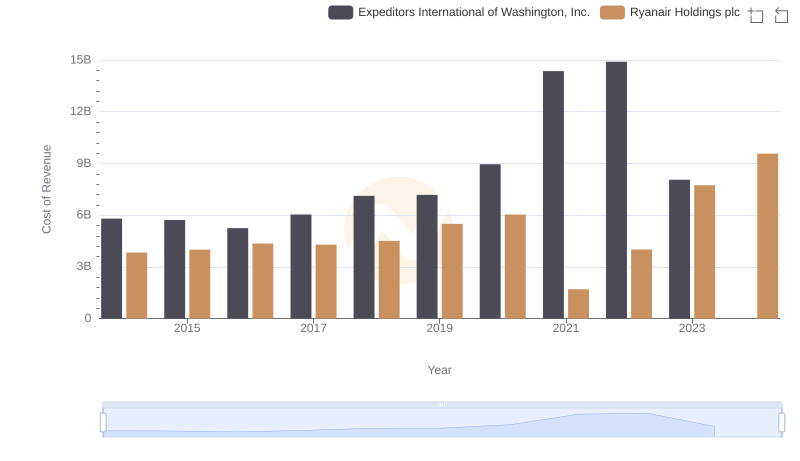
Cost Insights: Breaking Down Ryanair Holdings plc and Expeditors International of Washington, Inc.'s Expenses
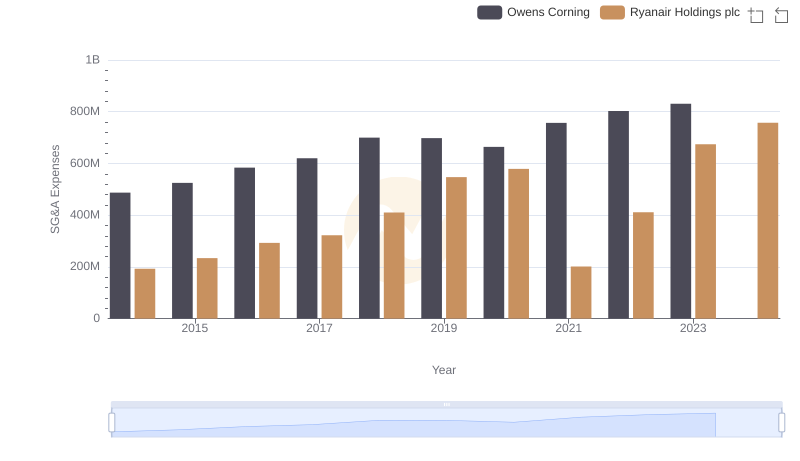
Comparing SG&A Expenses: Ryanair Holdings plc vs Owens Corning Trends and Insights
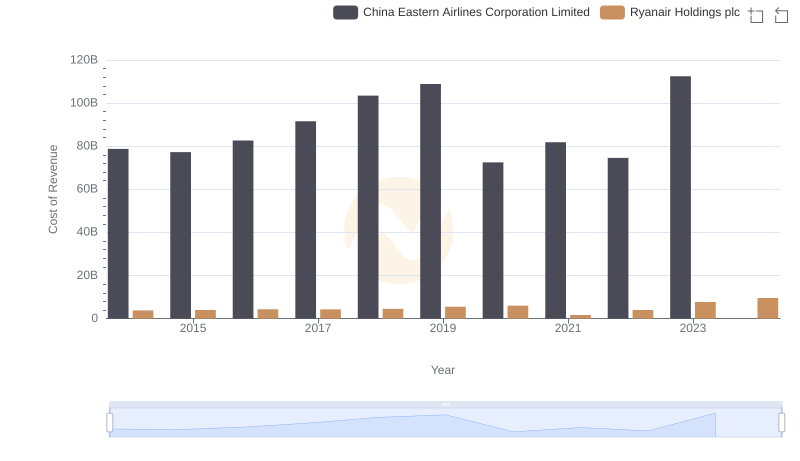
Ryanair Holdings plc vs China Eastern Airlines Corporation Limited: Efficiency in Cost of Revenue Explored
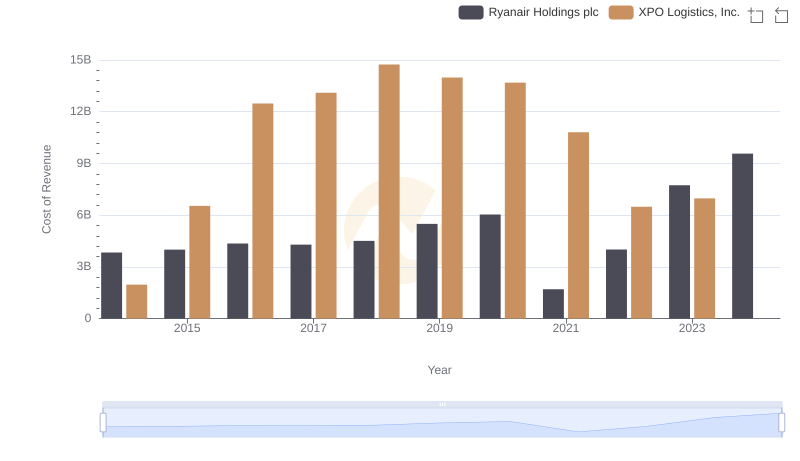
Cost of Revenue: Key Insights for Ryanair Holdings plc and XPO Logistics, Inc.
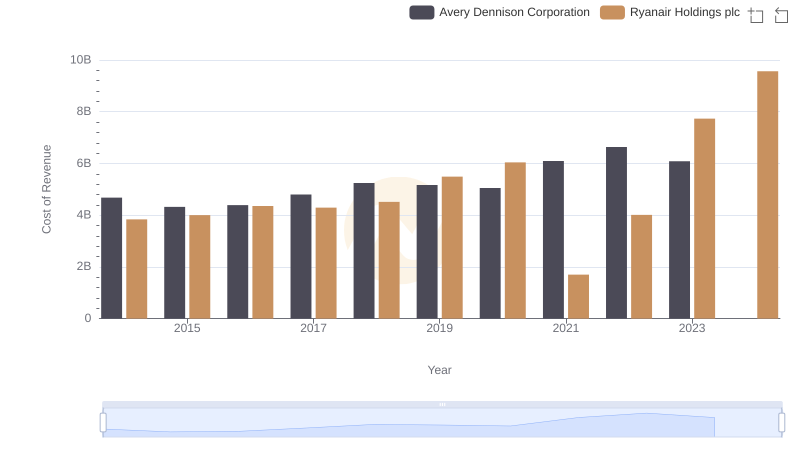
Ryanair Holdings plc vs Avery Dennison Corporation: Efficiency in Cost of Revenue Explored
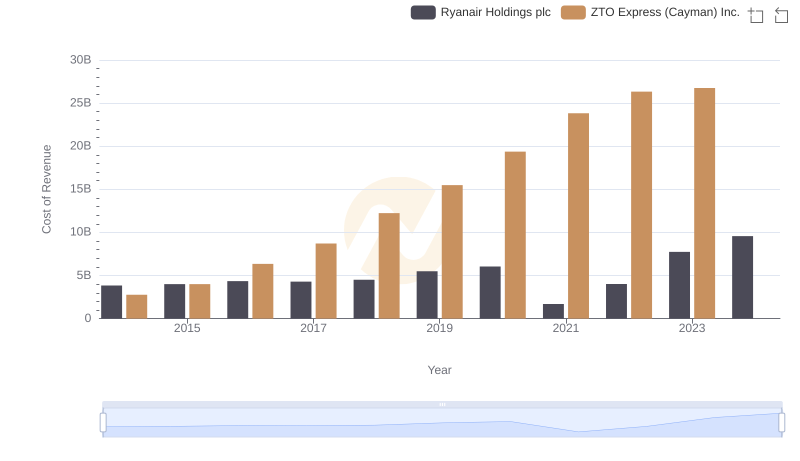
Cost Insights: Breaking Down Ryanair Holdings plc and ZTO Express (Cayman) Inc.'s Expenses