| __timestamp | Owens Corning | Ryanair Holdings plc |
|---|---|---|
| Wednesday, January 1, 2014 | 487000000 | 192800000 |
| Thursday, January 1, 2015 | 525000000 | 233900000 |
| Friday, January 1, 2016 | 584000000 | 292700000 |
| Sunday, January 1, 2017 | 620000000 | 322300000 |
| Monday, January 1, 2018 | 700000000 | 410400000 |
| Tuesday, January 1, 2019 | 698000000 | 547300000 |
| Wednesday, January 1, 2020 | 664000000 | 578800000 |
| Friday, January 1, 2021 | 757000000 | 201500000 |
| Saturday, January 1, 2022 | 803000000 | 411300000 |
| Sunday, January 1, 2023 | 831000000 | 674400000 |
| Monday, January 1, 2024 | 757200000 |
Unleashing the power of data
In the world of corporate finance, Selling, General, and Administrative (SG&A) expenses are a critical measure of a company's operational efficiency. This analysis compares the SG&A trends of Ryanair Holdings plc and Owens Corning from 2014 to 2023.
Owens Corning, a leader in building materials, has seen a steady increase in SG&A expenses, growing by approximately 71% over the decade. This reflects their strategic investments in marketing and administration to bolster their market position. In contrast, Ryanair Holdings plc, a major player in the airline industry, experienced a more volatile trend. Their SG&A expenses surged by about 250% from 2014 to 2023, peaking in 2024, indicating aggressive expansion and adaptation strategies.
While Owens Corning's expenses show consistent growth, Ryanair's fluctuations highlight the dynamic nature of the airline industry. This comparison offers valuable insights into how different sectors manage operational costs.
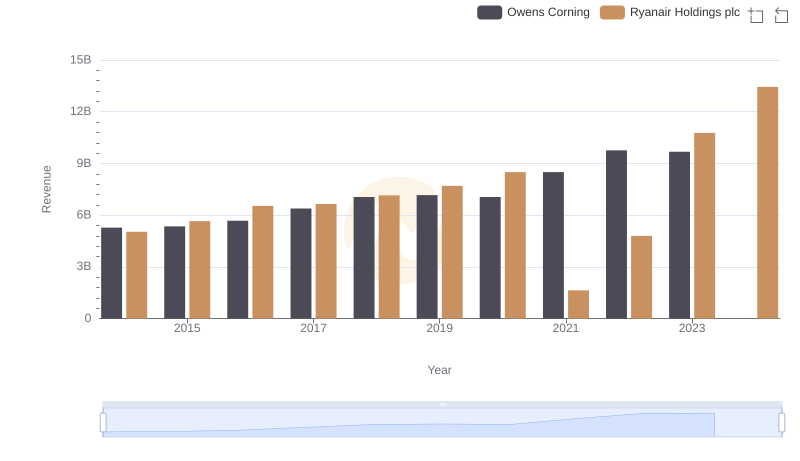
Revenue Showdown: Ryanair Holdings plc vs Owens Corning
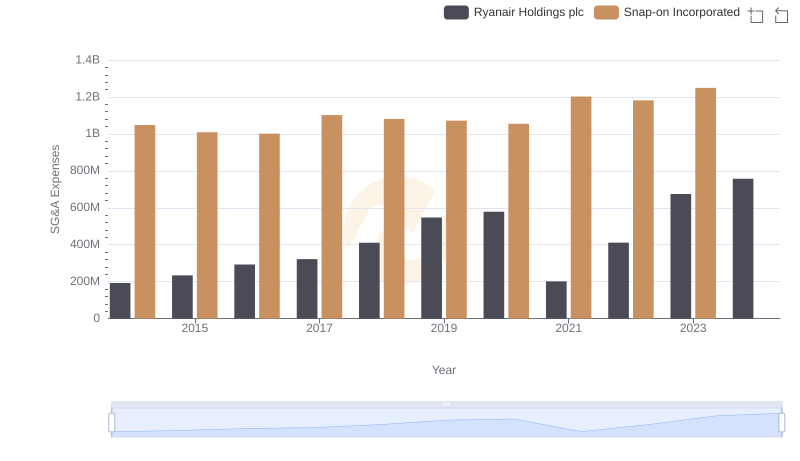
Comparing SG&A Expenses: Ryanair Holdings plc vs Snap-on Incorporated Trends and Insights
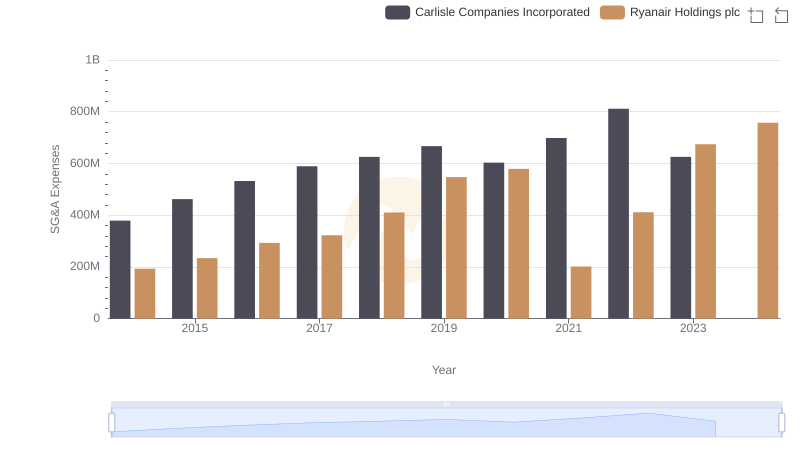
Selling, General, and Administrative Costs: Ryanair Holdings plc vs Carlisle Companies Incorporated
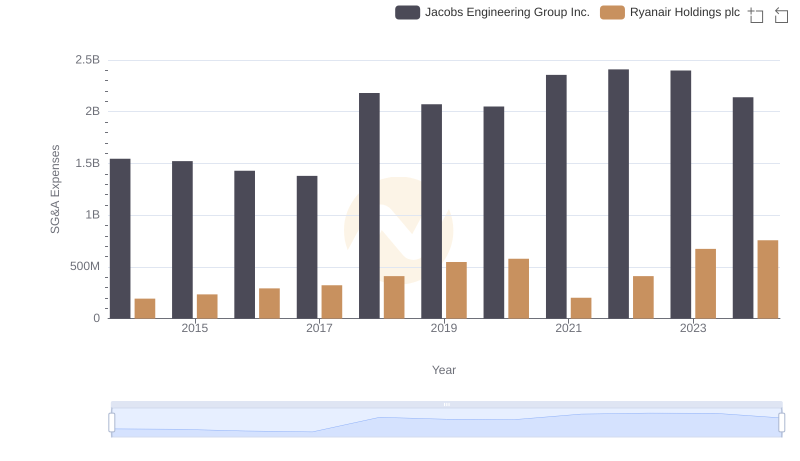
Who Optimizes SG&A Costs Better? Ryanair Holdings plc or Jacobs Engineering Group Inc.
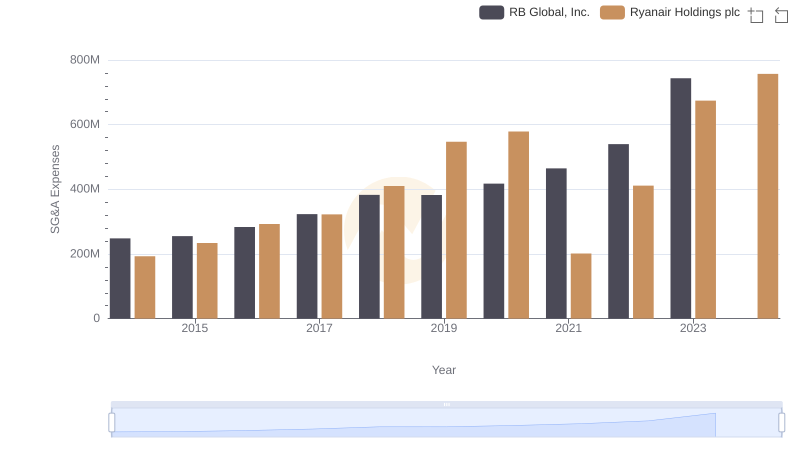
Comparing SG&A Expenses: Ryanair Holdings plc vs RB Global, Inc. Trends and Insights
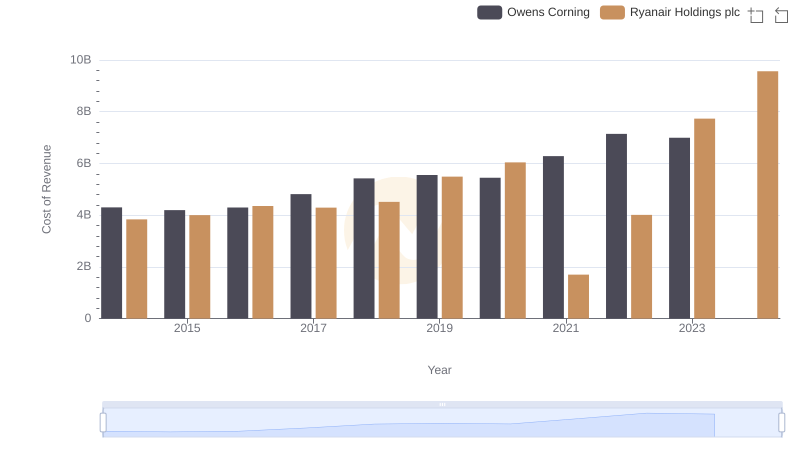
Ryanair Holdings plc vs Owens Corning: Efficiency in Cost of Revenue Explored
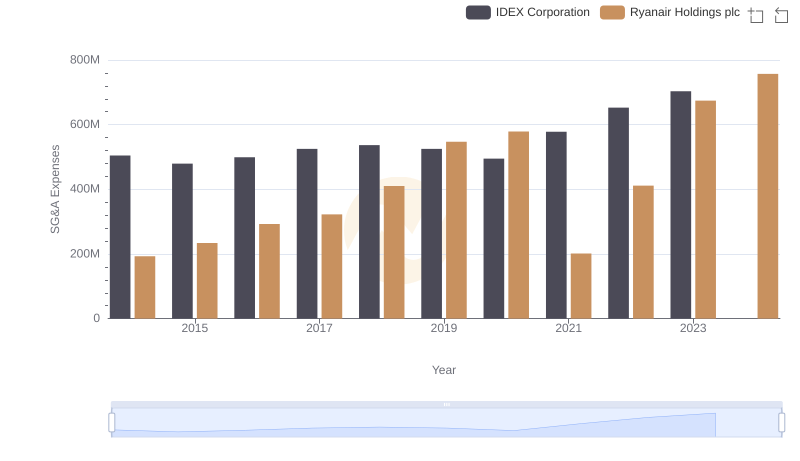
Ryanair Holdings plc and IDEX Corporation: SG&A Spending Patterns Compared
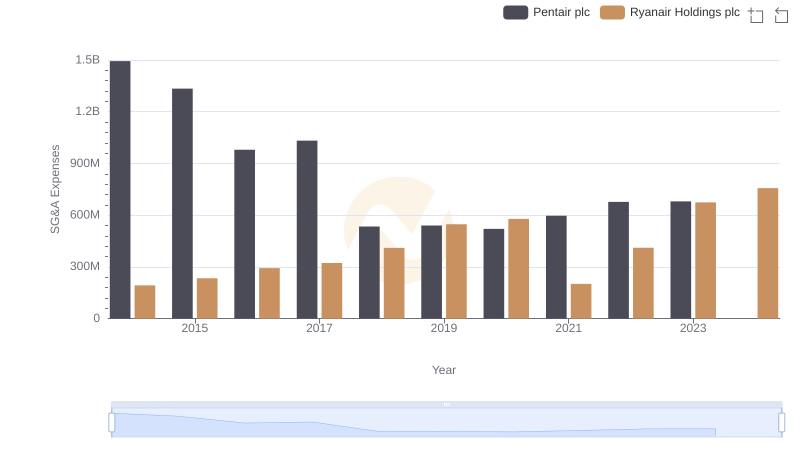
Ryanair Holdings plc and Pentair plc: SG&A Spending Patterns Compared
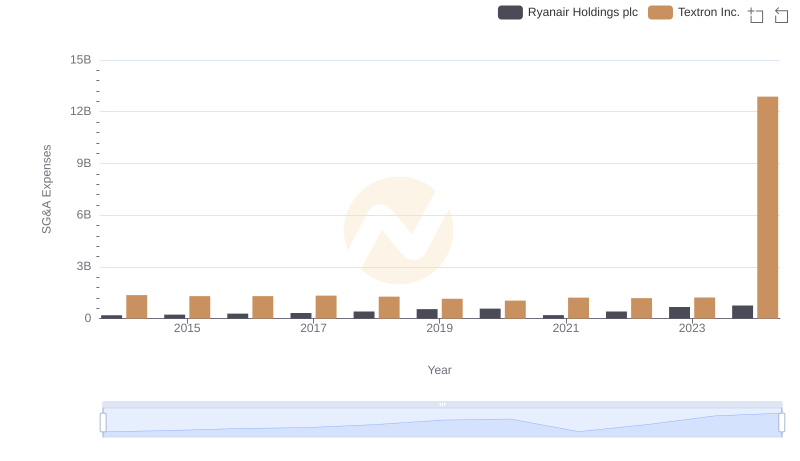
Who Optimizes SG&A Costs Better? Ryanair Holdings plc or Textron Inc.
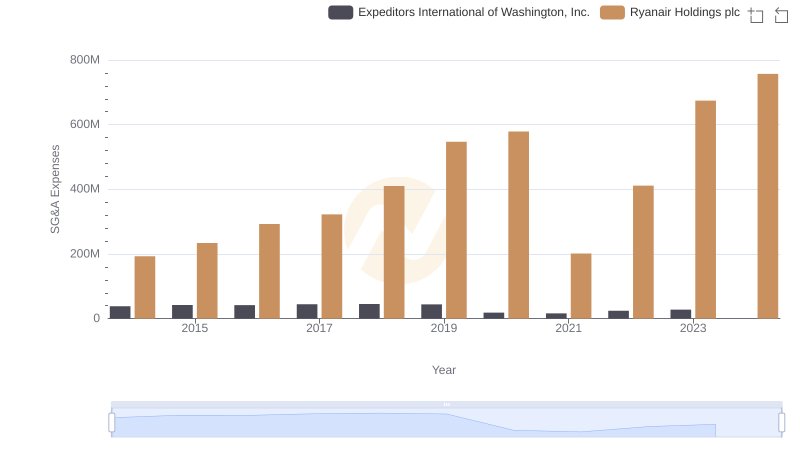
Selling, General, and Administrative Costs: Ryanair Holdings plc vs Expeditors International of Washington, Inc.
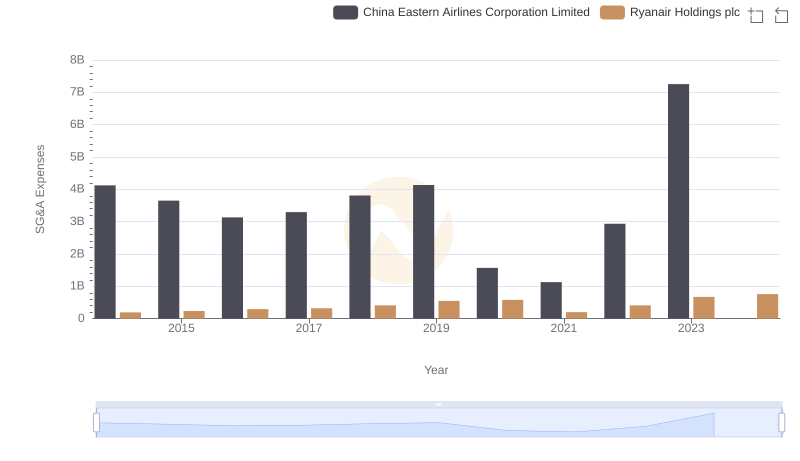
Ryanair Holdings plc vs China Eastern Airlines Corporation Limited: SG&A Expense Trends
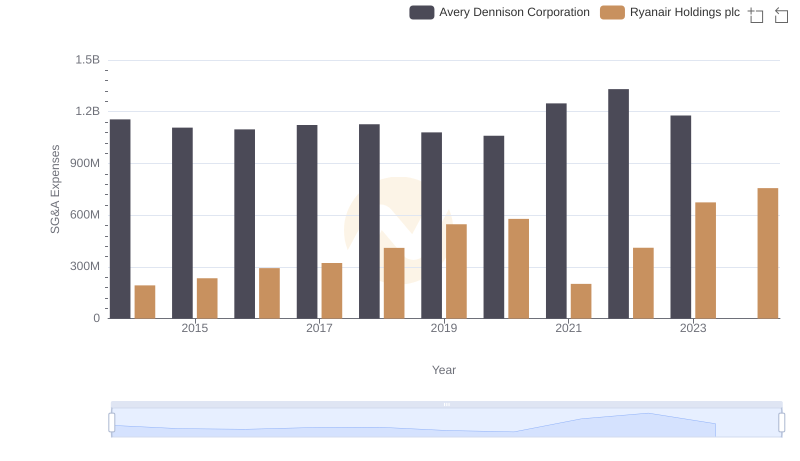
Breaking Down SG&A Expenses: Ryanair Holdings plc vs Avery Dennison Corporation