| __timestamp | Ryanair Holdings plc | XPO Logistics, Inc. |
|---|---|---|
| Wednesday, January 1, 2014 | 3838100000 | 1975000000 |
| Thursday, January 1, 2015 | 3999600000 | 6538400000 |
| Friday, January 1, 2016 | 4355900000 | 12480100000 |
| Sunday, January 1, 2017 | 4294000000 | 13101100000 |
| Monday, January 1, 2018 | 4512300000 | 14738000000 |
| Tuesday, January 1, 2019 | 5492800000 | 13982000000 |
| Wednesday, January 1, 2020 | 6039900000 | 13689000000 |
| Friday, January 1, 2021 | 1702700000 | 10812000000 |
| Saturday, January 1, 2022 | 4009800000 | 6491000000 |
| Sunday, January 1, 2023 | 7735000000 | 6974000000 |
| Monday, January 1, 2024 | 9566400000 | 7157000000 |
Unlocking the unknown
In the ever-evolving landscape of global business, understanding the cost of revenue is crucial for evaluating a company's operational efficiency. Ryanair Holdings plc and XPO Logistics, Inc. offer a fascinating case study in this regard. From 2014 to 2023, Ryanair's cost of revenue surged by approximately 150%, peaking in 2023. This growth reflects Ryanair's strategic expansion and operational scaling. In contrast, XPO Logistics experienced a more volatile trajectory, with a notable peak in 2018, followed by a decline. By 2023, XPO's cost of revenue had decreased by about 53% from its 2018 high. This divergence highlights differing business strategies and market conditions. Notably, data for XPO in 2024 is missing, suggesting potential shifts or reporting changes. This analysis underscores the importance of cost management in maintaining competitive advantage in the airline and logistics sectors.
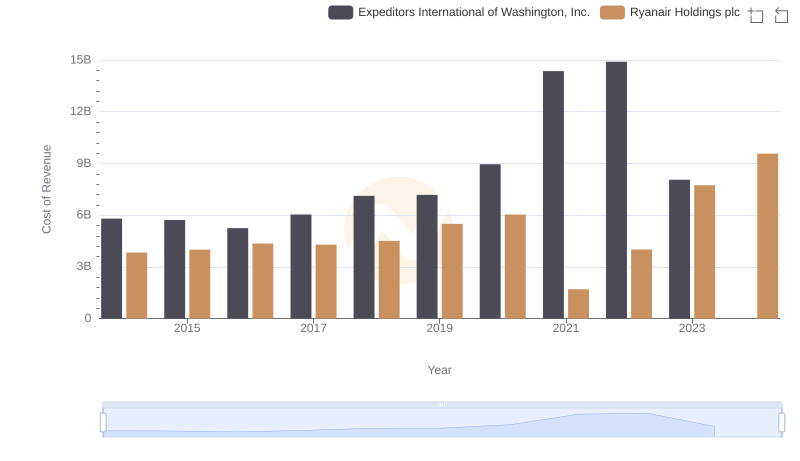
Cost Insights: Breaking Down Ryanair Holdings plc and Expeditors International of Washington, Inc.'s Expenses
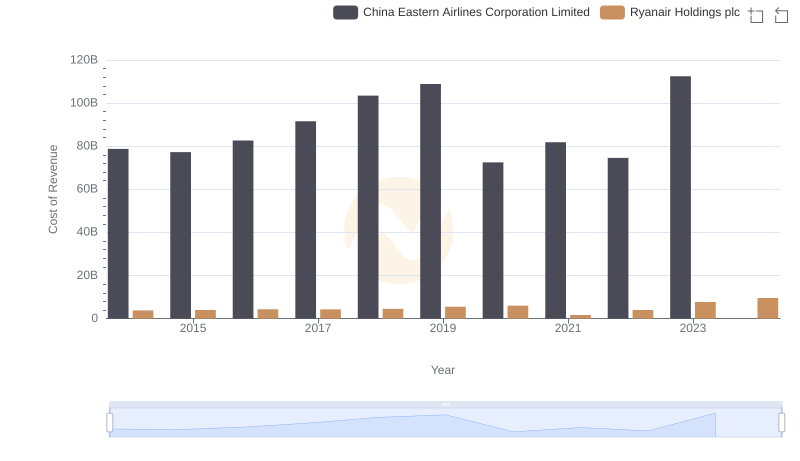
Ryanair Holdings plc vs China Eastern Airlines Corporation Limited: Efficiency in Cost of Revenue Explored
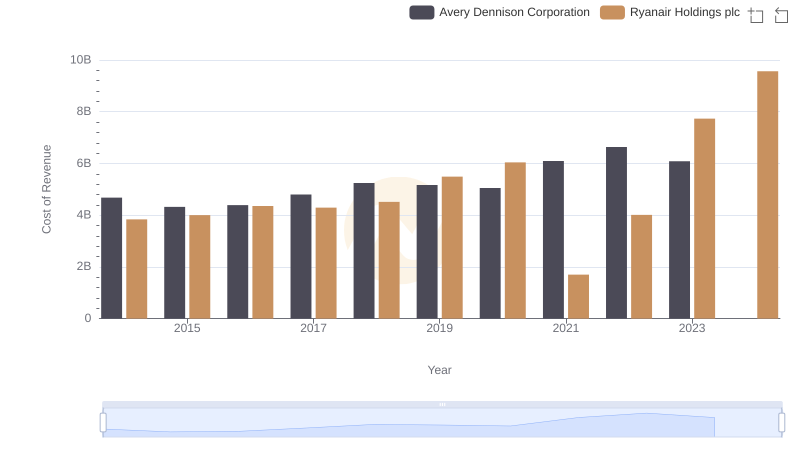
Ryanair Holdings plc vs Avery Dennison Corporation: Efficiency in Cost of Revenue Explored
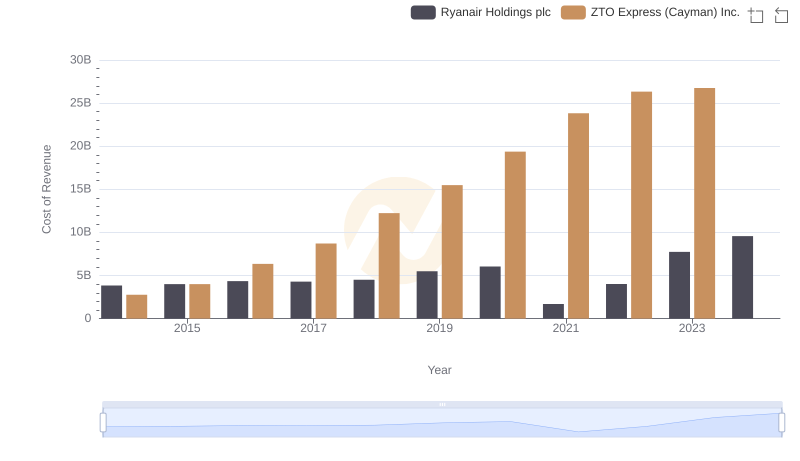
Cost Insights: Breaking Down Ryanair Holdings plc and ZTO Express (Cayman) Inc.'s Expenses
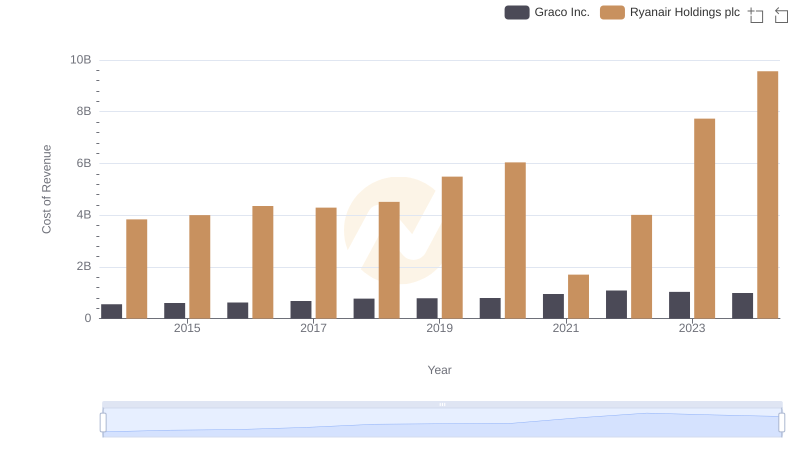
Ryanair Holdings plc vs Graco Inc.: Efficiency in Cost of Revenue Explored
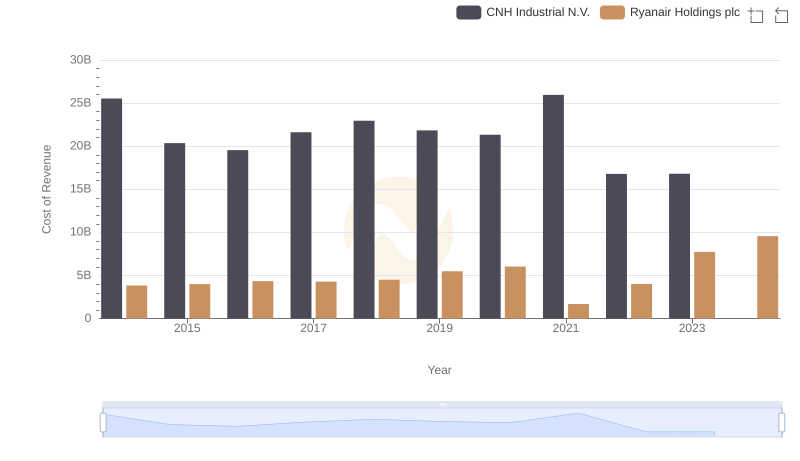
Analyzing Cost of Revenue: Ryanair Holdings plc and CNH Industrial N.V.
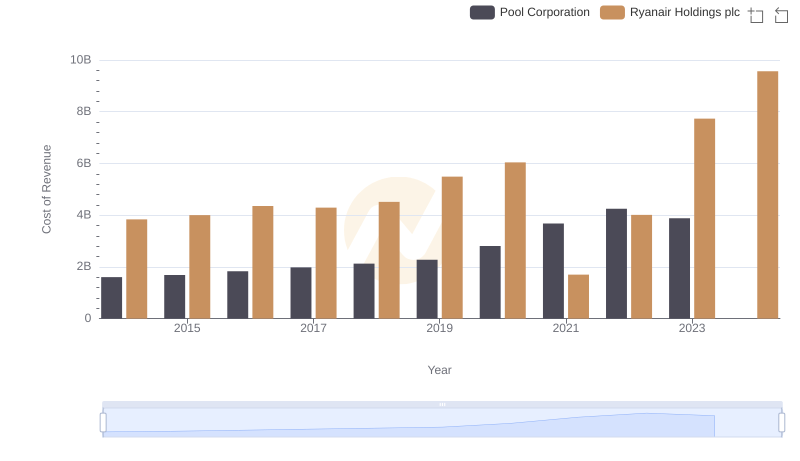
Cost Insights: Breaking Down Ryanair Holdings plc and Pool Corporation's Expenses
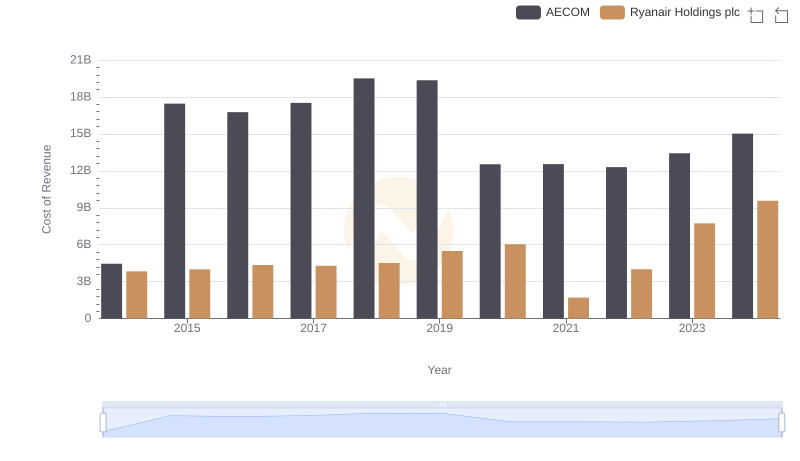
Cost Insights: Breaking Down Ryanair Holdings plc and AECOM's Expenses
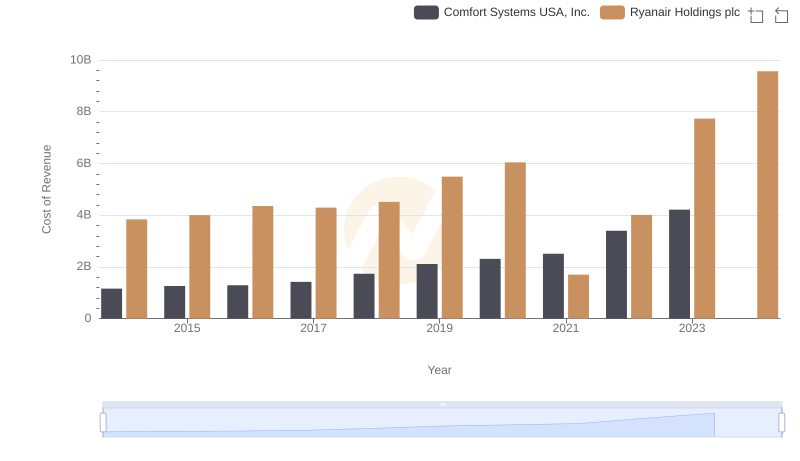
Cost of Revenue Trends: Ryanair Holdings plc vs Comfort Systems USA, Inc.
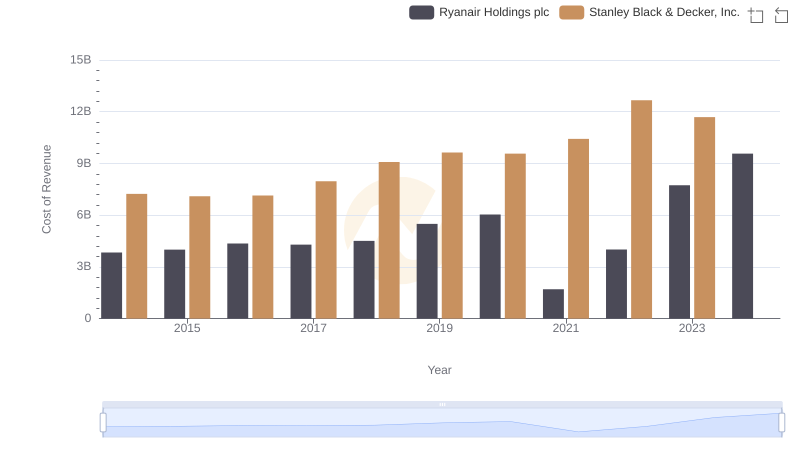
Cost of Revenue Comparison: Ryanair Holdings plc vs Stanley Black & Decker, Inc.
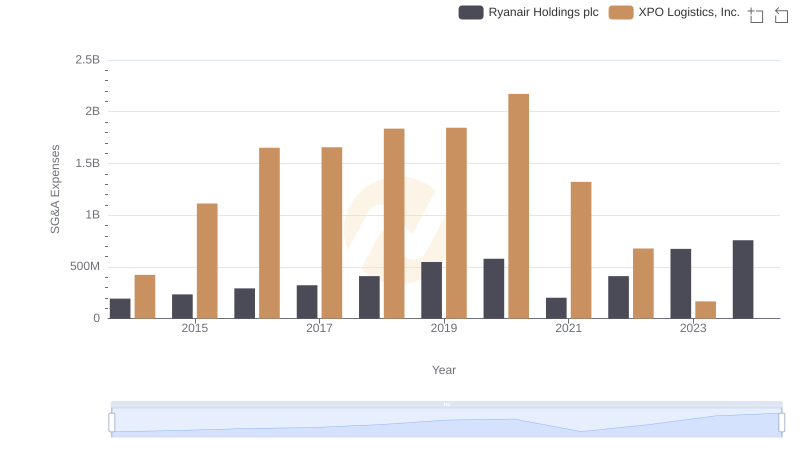
Breaking Down SG&A Expenses: Ryanair Holdings plc vs XPO Logistics, Inc.