| __timestamp | Jacobs Engineering Group Inc. | Rockwell Automation, Inc. |
|---|---|---|
| Wednesday, January 1, 2014 | 10621373000 | 3869600000 |
| Thursday, January 1, 2015 | 10146494000 | 3604800000 |
| Friday, January 1, 2016 | 9196326000 | 3404000000 |
| Sunday, January 1, 2017 | 8250536000 | 3687100000 |
| Monday, January 1, 2018 | 12156276000 | 3793800000 |
| Tuesday, January 1, 2019 | 10260840000 | 3794700000 |
| Wednesday, January 1, 2020 | 10980307000 | 3734600000 |
| Friday, January 1, 2021 | 11048860000 | 4099700000 |
| Saturday, January 1, 2022 | 11595785000 | 4658400000 |
| Sunday, January 1, 2023 | 12879099000 | 5341000000 |
| Monday, January 1, 2024 | 8668185000 | 5070800000 |
Unleashing the power of data
In the ever-evolving landscape of industrial automation and engineering, understanding cost dynamics is crucial. From 2014 to 2023, Jacobs Engineering Group Inc. and Rockwell Automation, Inc. have shown distinct trends in their cost of revenue. Jacobs Engineering's cost of revenue peaked in 2023, marking a 56% increase from its lowest point in 2017. Meanwhile, Rockwell Automation saw a steady rise, with a notable 39% increase from 2014 to 2023. This data highlights the strategic shifts and market adaptations these companies have undertaken. As we look to 2024, Jacobs Engineering's projected decrease suggests a potential strategic pivot, while Rockwell Automation's consistent growth underscores its robust market positioning. These insights offer a window into the financial strategies shaping the future of industrial giants.
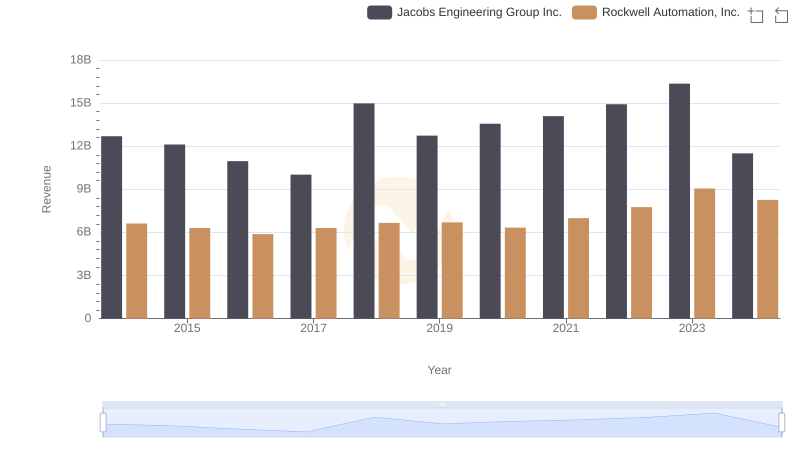
Rockwell Automation, Inc. vs Jacobs Engineering Group Inc.: Annual Revenue Growth Compared
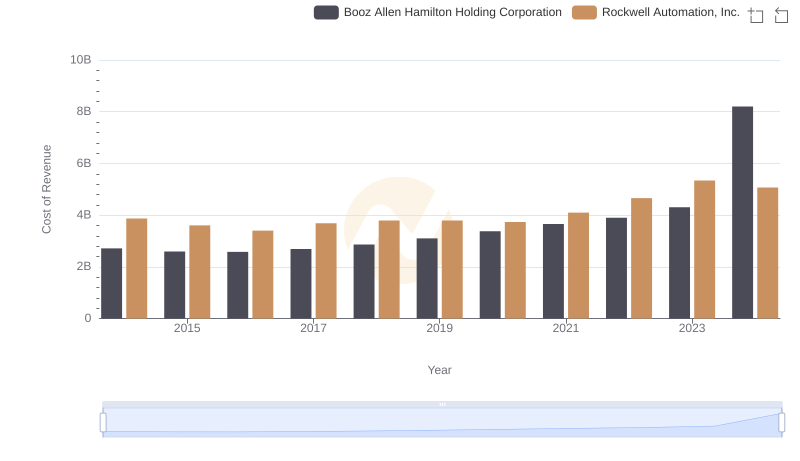
Rockwell Automation, Inc. vs Booz Allen Hamilton Holding Corporation: Efficiency in Cost of Revenue Explored
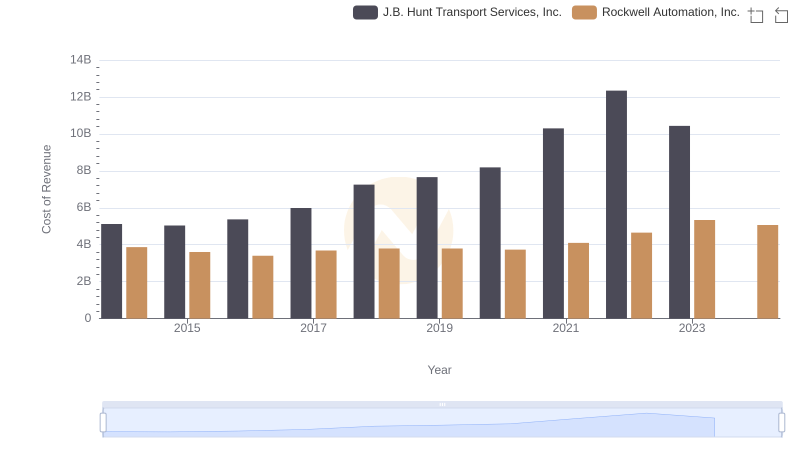
Analyzing Cost of Revenue: Rockwell Automation, Inc. and J.B. Hunt Transport Services, Inc.
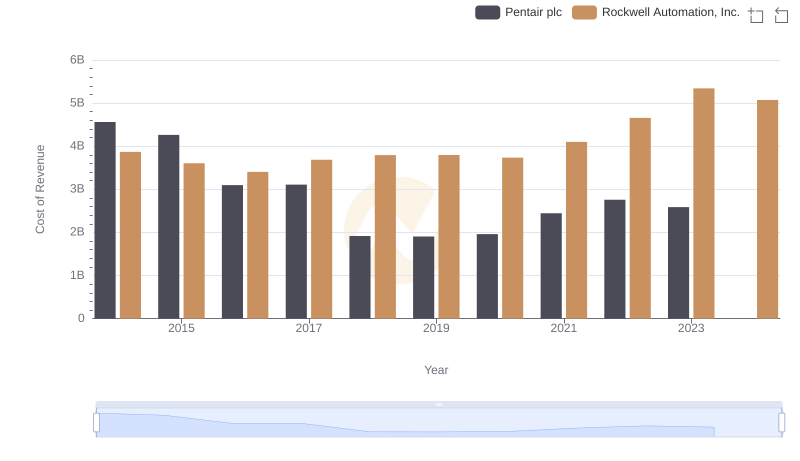
Cost of Revenue Trends: Rockwell Automation, Inc. vs Pentair plc
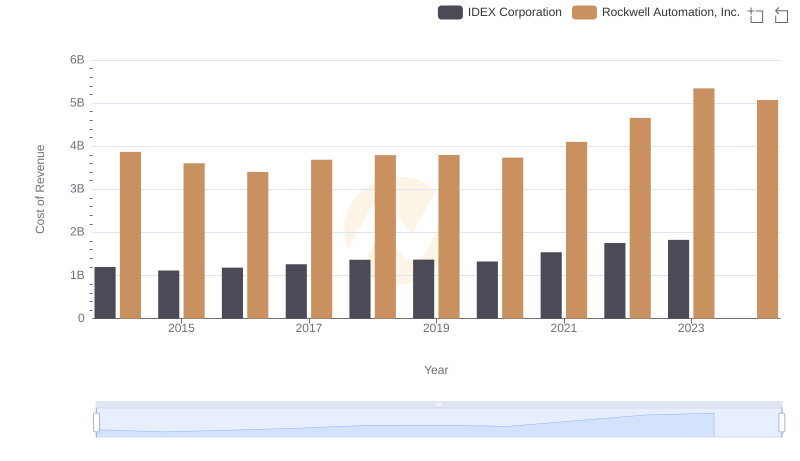
Cost Insights: Breaking Down Rockwell Automation, Inc. and IDEX Corporation's Expenses
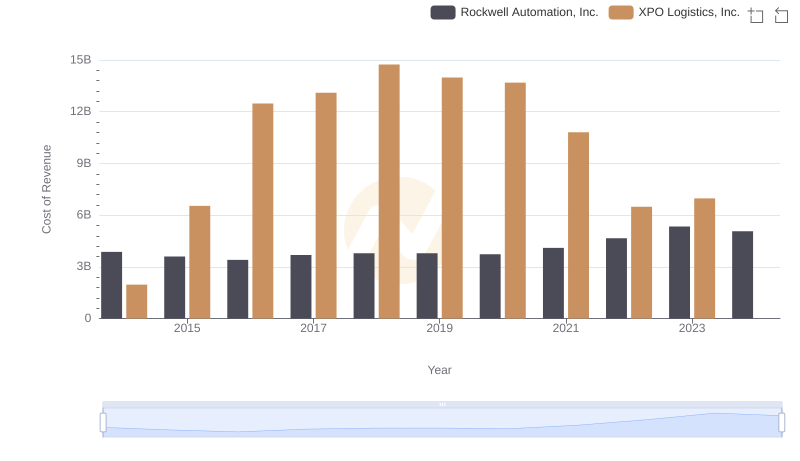
Cost of Revenue: Key Insights for Rockwell Automation, Inc. and XPO Logistics, Inc.
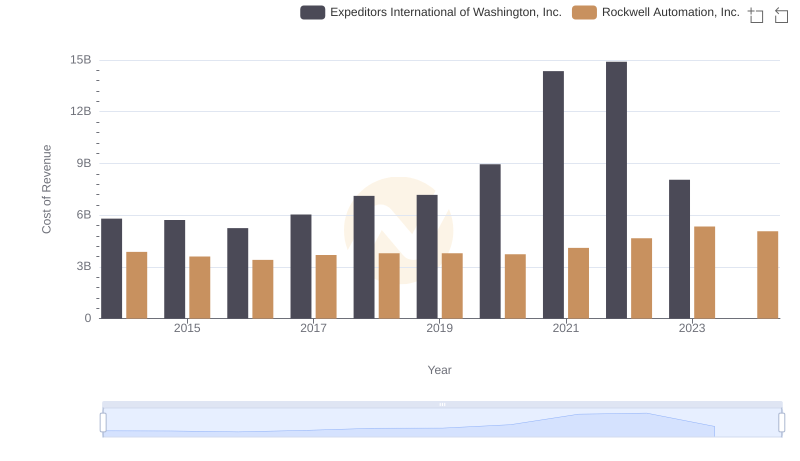
Analyzing Cost of Revenue: Rockwell Automation, Inc. and Expeditors International of Washington, Inc.
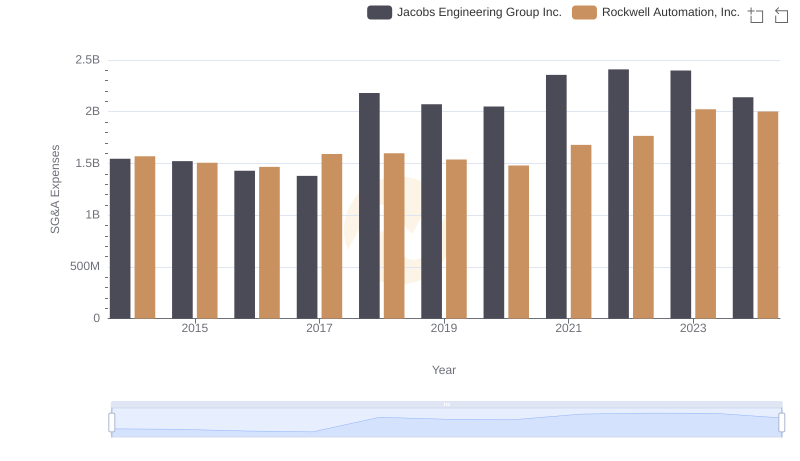
Rockwell Automation, Inc. vs Jacobs Engineering Group Inc.: SG&A Expense Trends
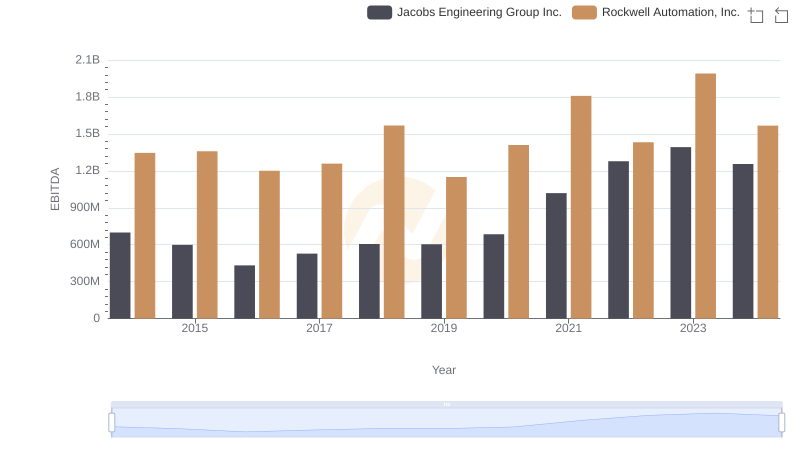
Rockwell Automation, Inc. vs Jacobs Engineering Group Inc.: In-Depth EBITDA Performance Comparison