| __timestamp | Jacobs Engineering Group Inc. | Rockwell Automation, Inc. |
|---|---|---|
| Wednesday, January 1, 2014 | 699015000 | 1346000000 |
| Thursday, January 1, 2015 | 598932000 | 1359100000 |
| Friday, January 1, 2016 | 431954000 | 1200700000 |
| Sunday, January 1, 2017 | 527765000 | 1258400000 |
| Monday, January 1, 2018 | 606328000 | 1568400000 |
| Tuesday, January 1, 2019 | 604075000 | 1150200000 |
| Wednesday, January 1, 2020 | 685042000 | 1410200000 |
| Friday, January 1, 2021 | 1019116000 | 1808300000 |
| Saturday, January 1, 2022 | 1277649000 | 1432100000 |
| Sunday, January 1, 2023 | 1392039000 | 1990700000 |
| Monday, January 1, 2024 | 1255083000 | 1567500000 |
Unlocking the unknown
In the ever-evolving landscape of industrial automation and engineering, Rockwell Automation and Jacobs Engineering have been pivotal players. Over the past decade, Rockwell Automation has consistently outperformed Jacobs Engineering in terms of EBITDA, showcasing a robust growth trajectory. From 2014 to 2023, Rockwell Automation's EBITDA grew by approximately 48%, peaking in 2023 with a remarkable 1.99 billion USD. In contrast, Jacobs Engineering experienced a more modest growth of around 99% during the same period, reaching its highest EBITDA of 1.39 billion USD in 2023.
The data reveals a compelling narrative of resilience and strategic growth, particularly for Rockwell Automation, which maintained a steady upward trend despite market fluctuations. As we look towards 2024, both companies continue to demonstrate strong financial health, with Rockwell Automation leading the charge in the industrial sector.
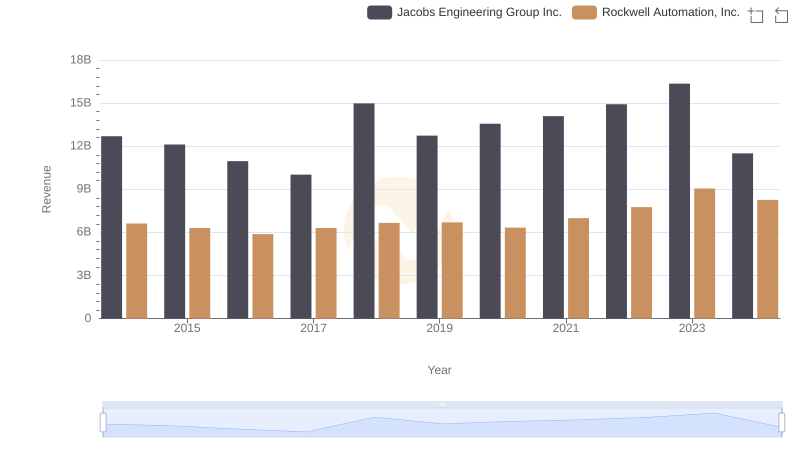
Rockwell Automation, Inc. vs Jacobs Engineering Group Inc.: Annual Revenue Growth Compared
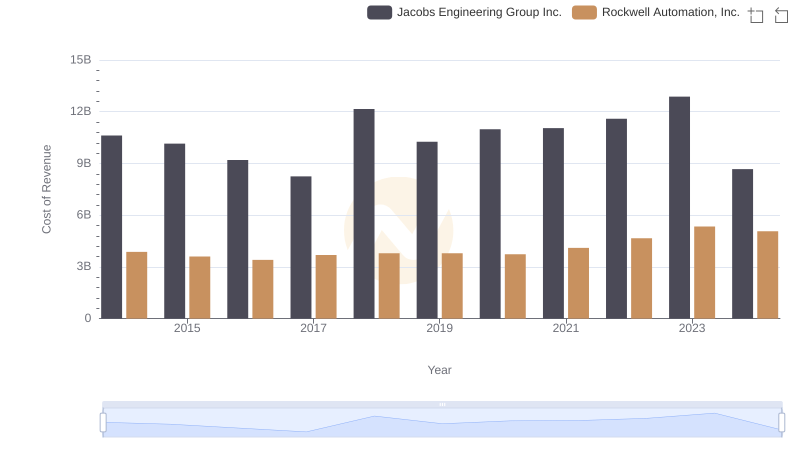
Cost of Revenue: Key Insights for Rockwell Automation, Inc. and Jacobs Engineering Group Inc.
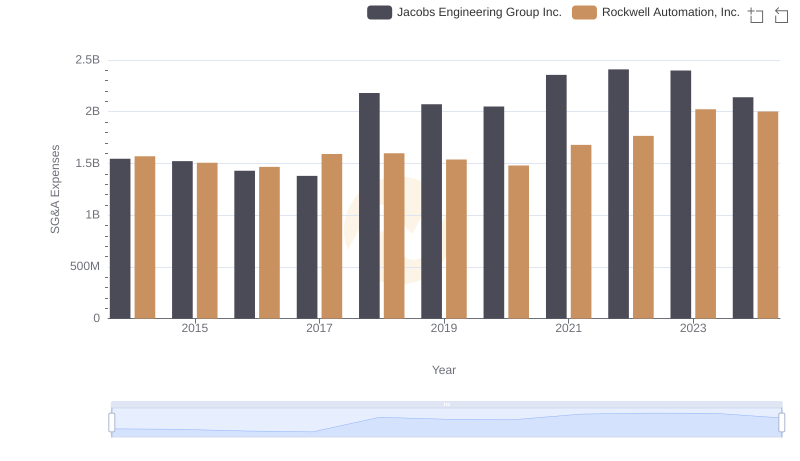
Rockwell Automation, Inc. vs Jacobs Engineering Group Inc.: SG&A Expense Trends

A Side-by-Side Analysis of EBITDA: Rockwell Automation, Inc. and Carlisle Companies Incorporated
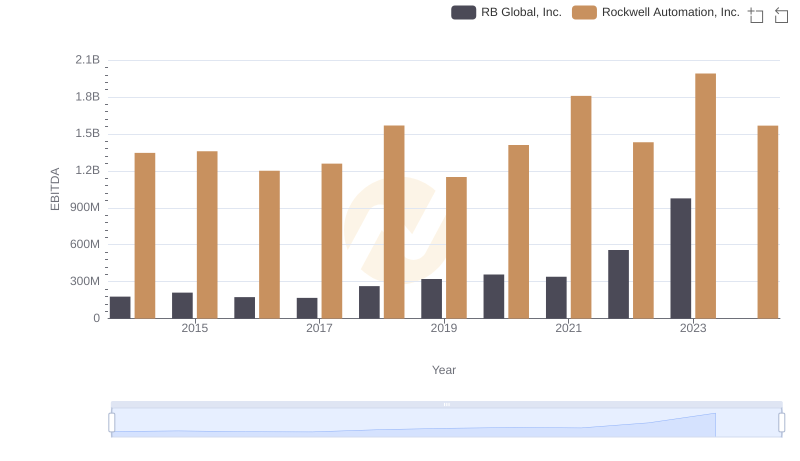
Rockwell Automation, Inc. and RB Global, Inc.: A Detailed Examination of EBITDA Performance
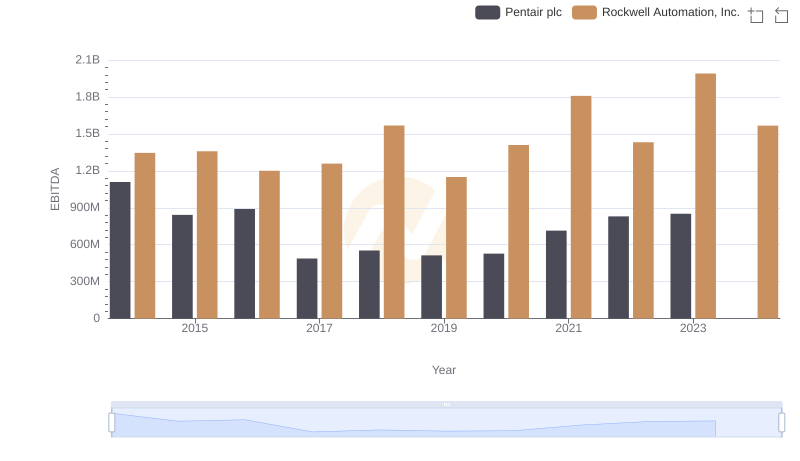
Comprehensive EBITDA Comparison: Rockwell Automation, Inc. vs Pentair plc
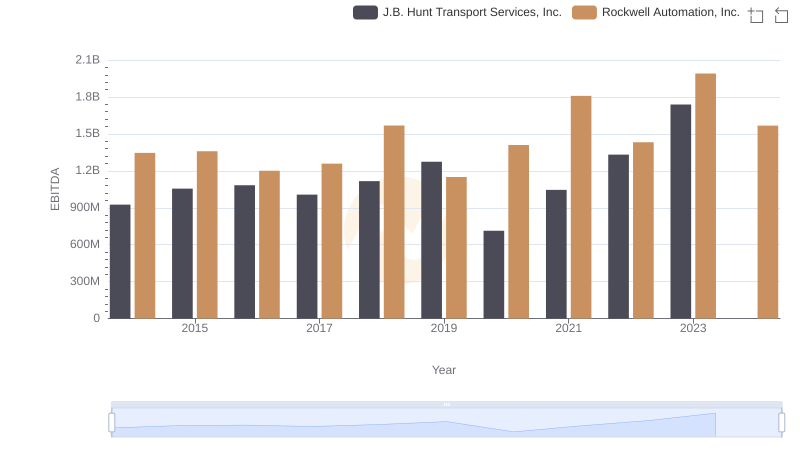
Rockwell Automation, Inc. and J.B. Hunt Transport Services, Inc.: A Detailed Examination of EBITDA Performance

Comprehensive EBITDA Comparison: Rockwell Automation, Inc. vs XPO Logistics, Inc.

A Professional Review of EBITDA: Rockwell Automation, Inc. Compared to Expeditors International of Washington, Inc.
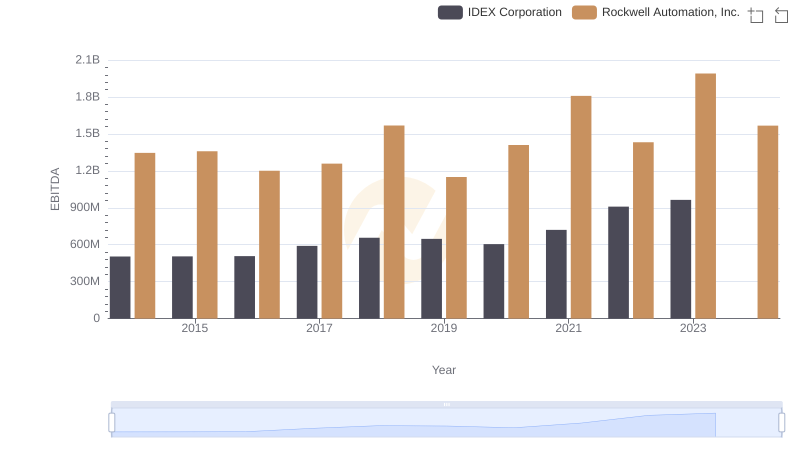
Rockwell Automation, Inc. vs IDEX Corporation: In-Depth EBITDA Performance Comparison