| __timestamp | Booz Allen Hamilton Holding Corporation | Rockwell Automation, Inc. |
|---|---|---|
| Wednesday, January 1, 2014 | 5478693000 | 6623500000 |
| Thursday, January 1, 2015 | 5274770000 | 6307900000 |
| Friday, January 1, 2016 | 5405738000 | 5879500000 |
| Sunday, January 1, 2017 | 5804284000 | 6311300000 |
| Monday, January 1, 2018 | 6171853000 | 6666000000 |
| Tuesday, January 1, 2019 | 6704037000 | 6694800000 |
| Wednesday, January 1, 2020 | 7463841000 | 6329800000 |
| Friday, January 1, 2021 | 7858938000 | 6997400000 |
| Saturday, January 1, 2022 | 8363700000 | 7760400000 |
| Sunday, January 1, 2023 | 9258911000 | 9058000000 |
| Monday, January 1, 2024 | 10661896000 | 8264200000 |
Cracking the code
In the ever-evolving landscape of industrial automation and consulting services, Rockwell Automation, Inc. and Booz Allen Hamilton Holding Corporation stand as titans. Over the past decade, Booz Allen Hamilton has demonstrated a robust growth trajectory, with its revenue surging by approximately 94% from 2014 to 2024. This growth reflects the increasing demand for strategic consulting services in a digital-first world. Meanwhile, Rockwell Automation, a leader in industrial automation, saw a more modest revenue increase of around 25% over the same period. This growth underscores the steady demand for automation solutions, despite economic fluctuations. Notably, 2023 marked a peak year for both companies, with Booz Allen Hamilton reaching its highest revenue, while Rockwell Automation also achieved significant gains. As we look to the future, these trends highlight the dynamic nature of these industries and the pivotal roles these companies play in shaping them.

Who Generates More Revenue? Rockwell Automation, Inc. or Masco Corporation
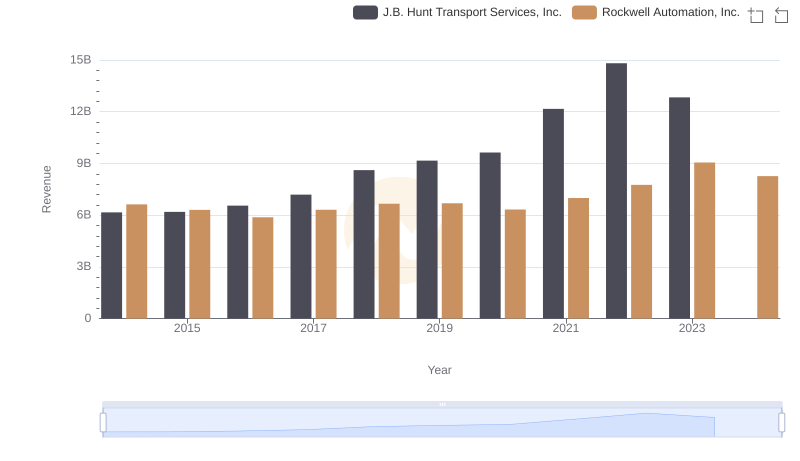
Rockwell Automation, Inc. vs J.B. Hunt Transport Services, Inc.: Annual Revenue Growth Compared
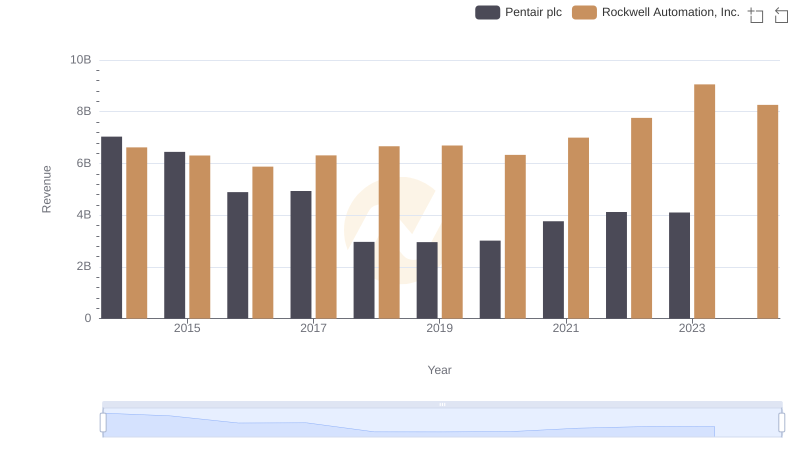
Revenue Insights: Rockwell Automation, Inc. and Pentair plc Performance Compared
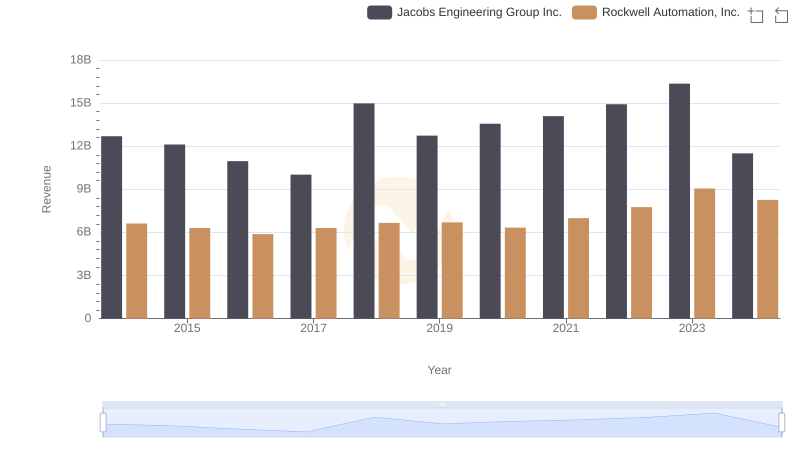
Rockwell Automation, Inc. vs Jacobs Engineering Group Inc.: Annual Revenue Growth Compared
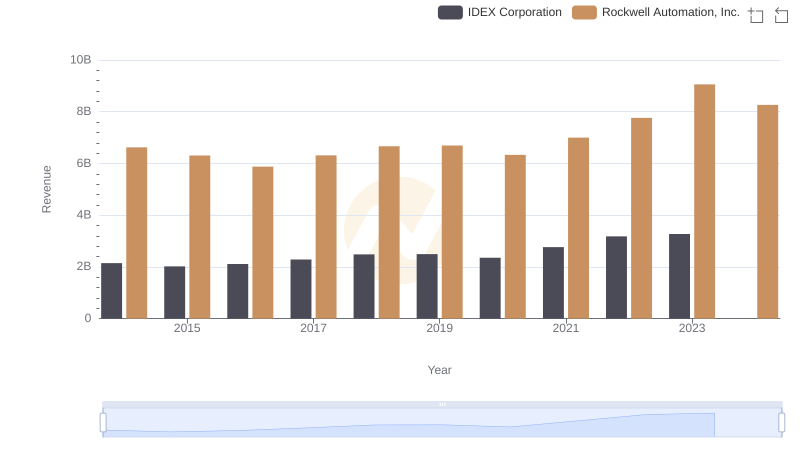
Comparing Revenue Performance: Rockwell Automation, Inc. or IDEX Corporation?
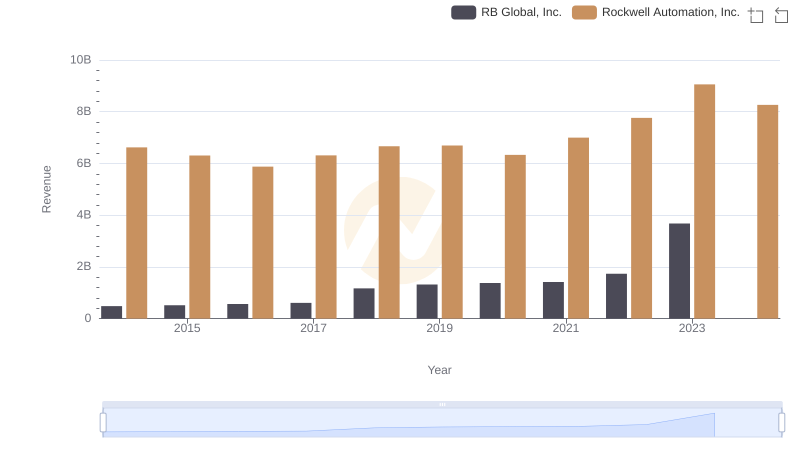
Rockwell Automation, Inc. and RB Global, Inc.: A Comprehensive Revenue Analysis
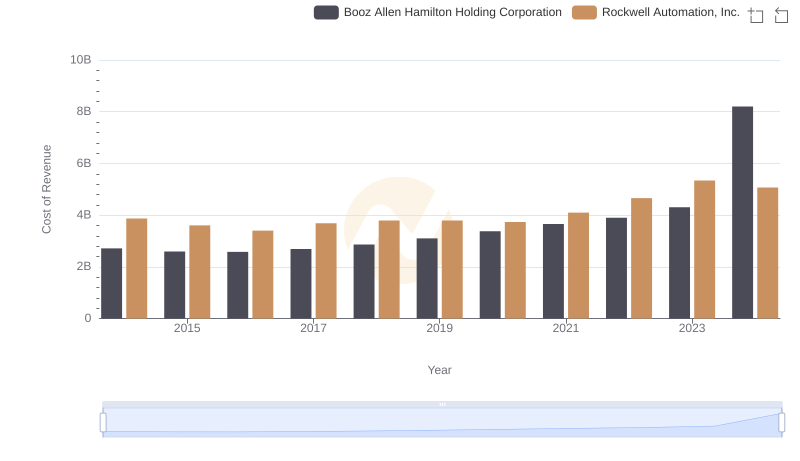
Rockwell Automation, Inc. vs Booz Allen Hamilton Holding Corporation: Efficiency in Cost of Revenue Explored
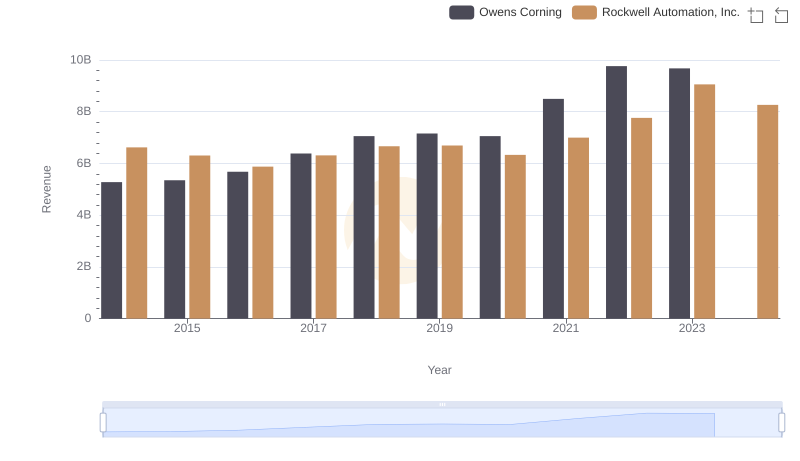
Who Generates More Revenue? Rockwell Automation, Inc. or Owens Corning
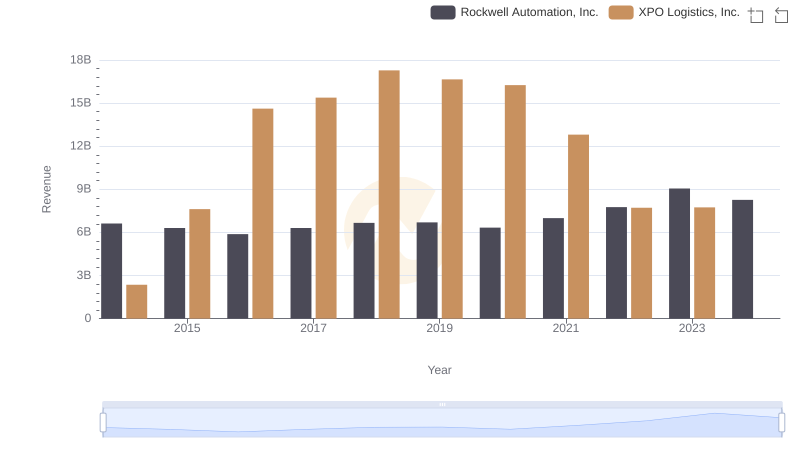
Revenue Showdown: Rockwell Automation, Inc. vs XPO Logistics, Inc.
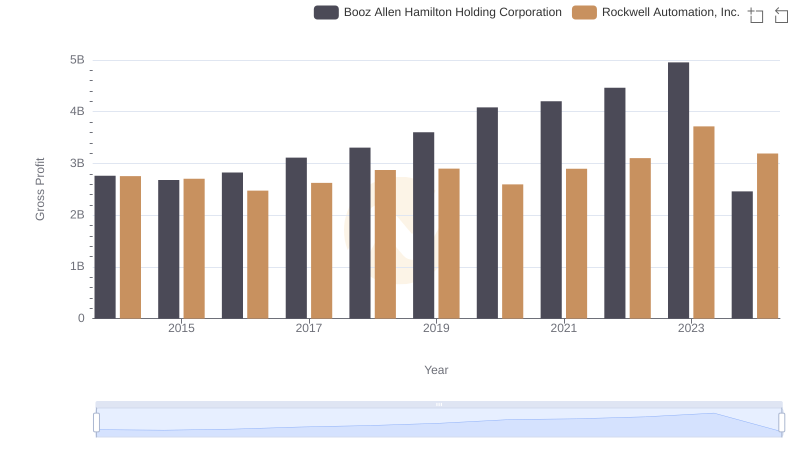
Gross Profit Trends Compared: Rockwell Automation, Inc. vs Booz Allen Hamilton Holding Corporation
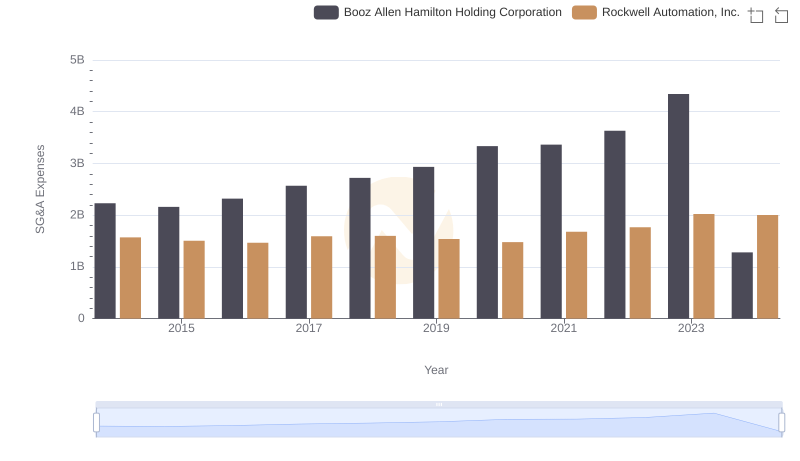
SG&A Efficiency Analysis: Comparing Rockwell Automation, Inc. and Booz Allen Hamilton Holding Corporation