| __timestamp | Curtiss-Wright Corporation | Rockwell Automation, Inc. |
|---|---|---|
| Wednesday, January 1, 2014 | 776516000 | 2753900000 |
| Thursday, January 1, 2015 | 783255000 | 2703100000 |
| Friday, January 1, 2016 | 750483000 | 2475500000 |
| Sunday, January 1, 2017 | 818595000 | 2624200000 |
| Monday, January 1, 2018 | 871261000 | 2872200000 |
| Tuesday, January 1, 2019 | 898745000 | 2900100000 |
| Wednesday, January 1, 2020 | 841227000 | 2595200000 |
| Friday, January 1, 2021 | 933356000 | 2897700000 |
| Saturday, January 1, 2022 | 954609000 | 3102000000 |
| Sunday, January 1, 2023 | 1067178000 | 3717000000 |
| Monday, January 1, 2024 | 1153549000 | 3193400000 |
Unleashing the power of data
In the competitive landscape of industrial automation and aerospace, Rockwell Automation, Inc. and Curtiss-Wright Corporation have shown distinct trajectories in their gross profit margins over the past decade. From 2014 to 2023, Rockwell Automation's gross profit surged by approximately 35%, peaking in 2023 with a remarkable $3.7 billion. This growth underscores its robust market position and strategic advancements in automation technologies.
Conversely, Curtiss-Wright Corporation exhibited a steady increase, with a notable 37% rise in gross profit, reaching over $1 billion by 2023. This growth reflects its resilience and adaptability in the aerospace and defense sectors. However, data for 2024 is incomplete, indicating potential fluctuations or strategic shifts.
These trends highlight the dynamic nature of these industries, where innovation and strategic foresight are key to sustaining growth and profitability.

Breaking Down Revenue Trends: Rockwell Automation, Inc. vs Curtiss-Wright Corporation
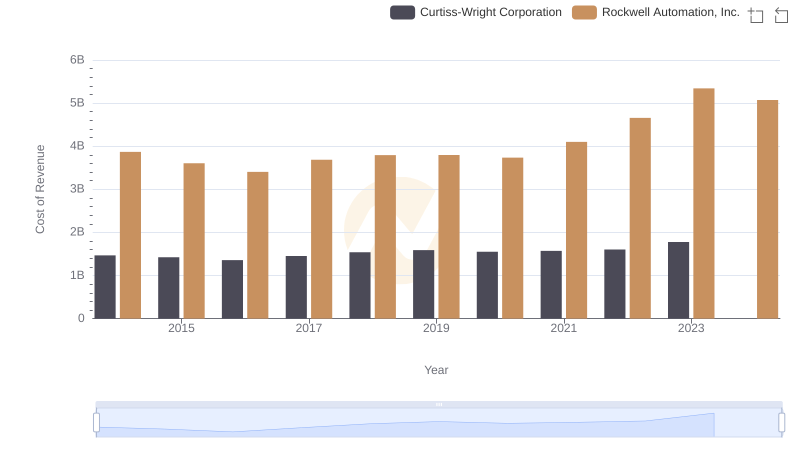
Cost of Revenue Trends: Rockwell Automation, Inc. vs Curtiss-Wright Corporation
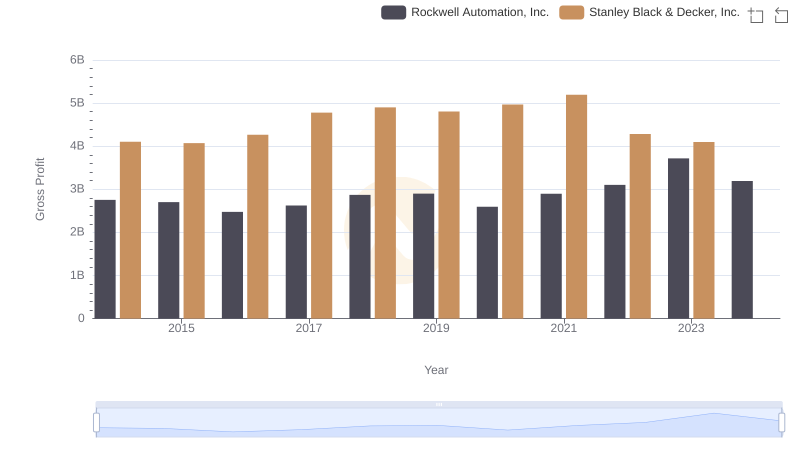
Who Generates Higher Gross Profit? Rockwell Automation, Inc. or Stanley Black & Decker, Inc.
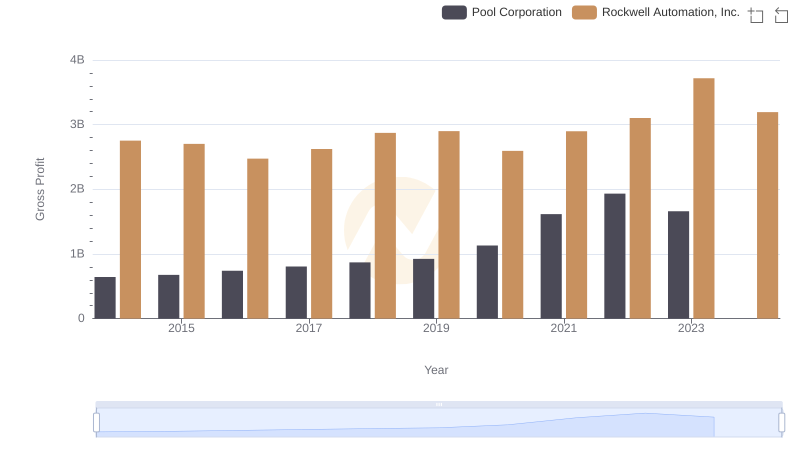
Rockwell Automation, Inc. and Pool Corporation: A Detailed Gross Profit Analysis
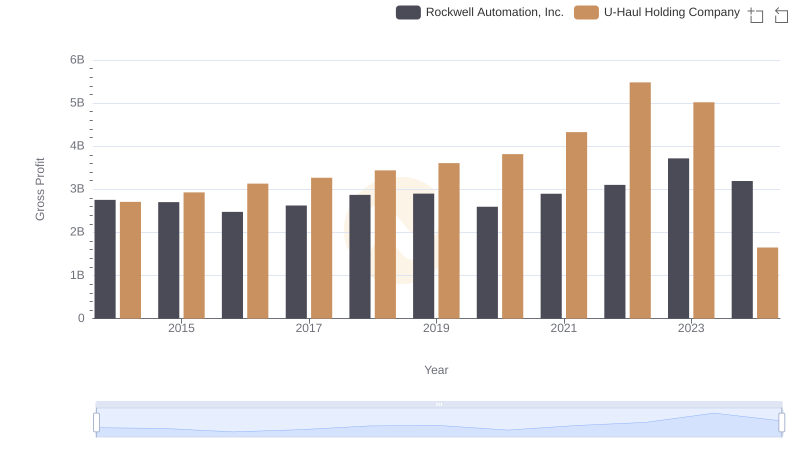
Who Generates Higher Gross Profit? Rockwell Automation, Inc. or U-Haul Holding Company
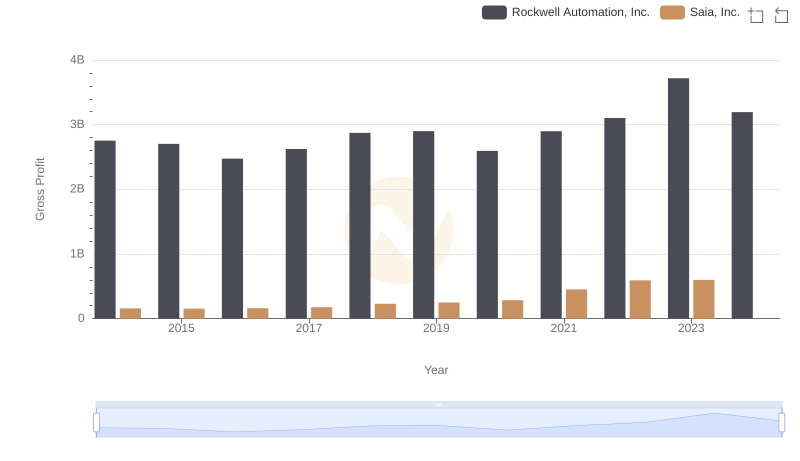
Key Insights on Gross Profit: Rockwell Automation, Inc. vs Saia, Inc.
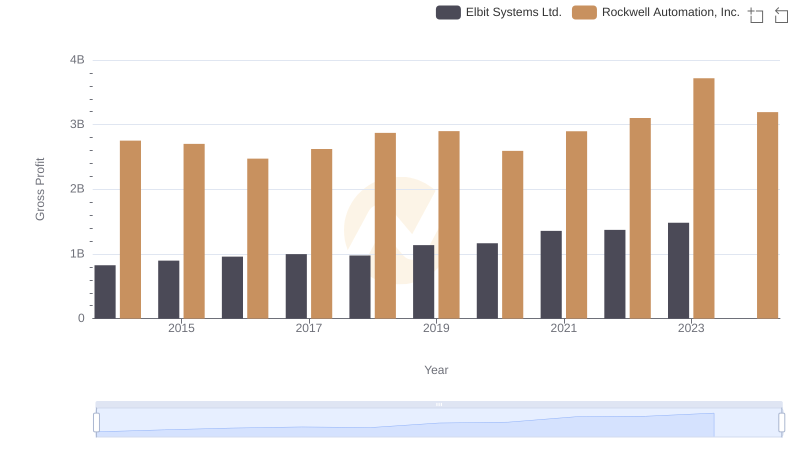
Rockwell Automation, Inc. vs Elbit Systems Ltd.: A Gross Profit Performance Breakdown
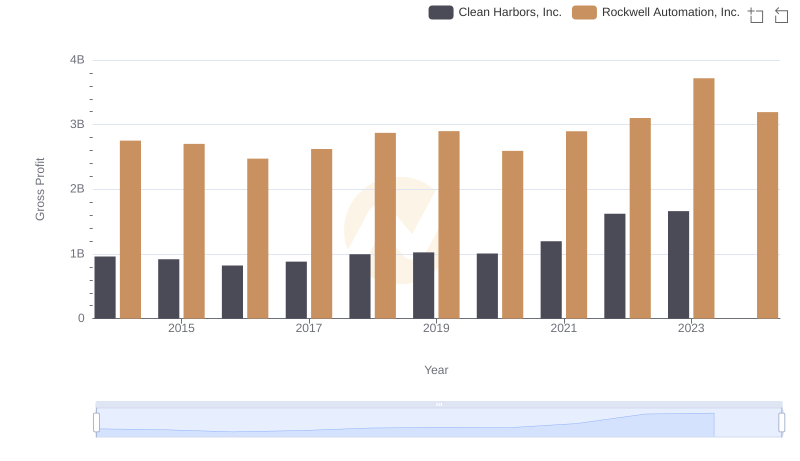
Rockwell Automation, Inc. vs Clean Harbors, Inc.: A Gross Profit Performance Breakdown
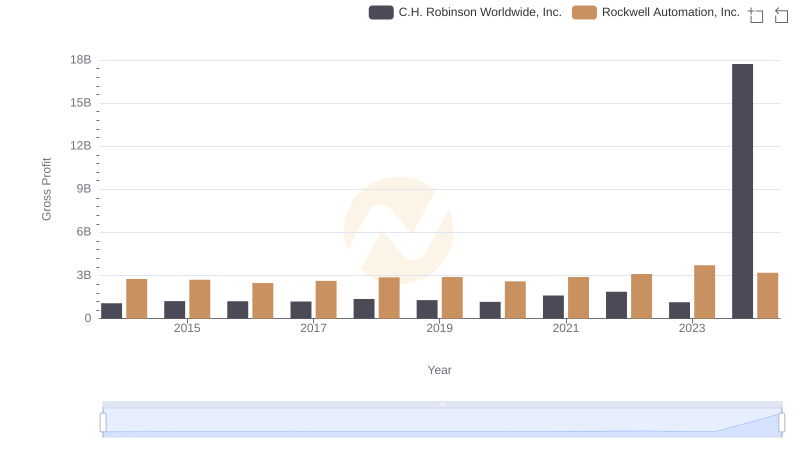
Key Insights on Gross Profit: Rockwell Automation, Inc. vs C.H. Robinson Worldwide, Inc.
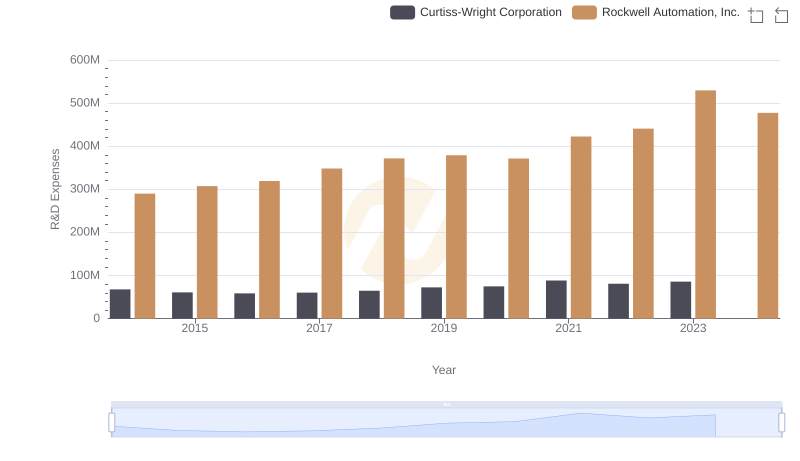
R&D Spending Showdown: Rockwell Automation, Inc. vs Curtiss-Wright Corporation
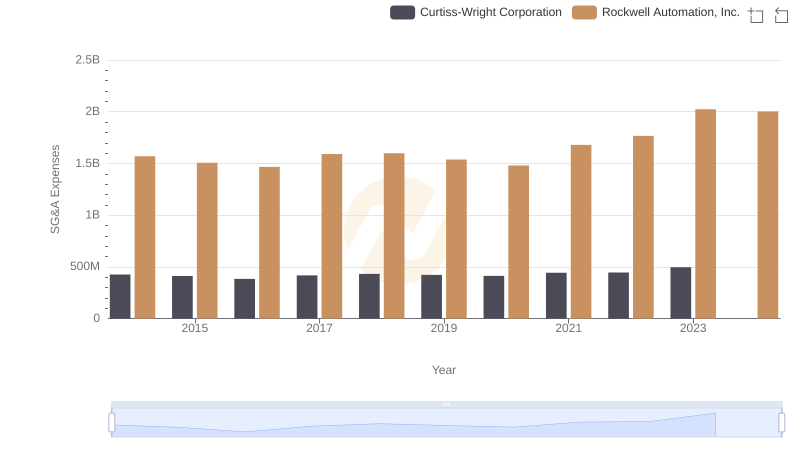
Comparing SG&A Expenses: Rockwell Automation, Inc. vs Curtiss-Wright Corporation Trends and Insights
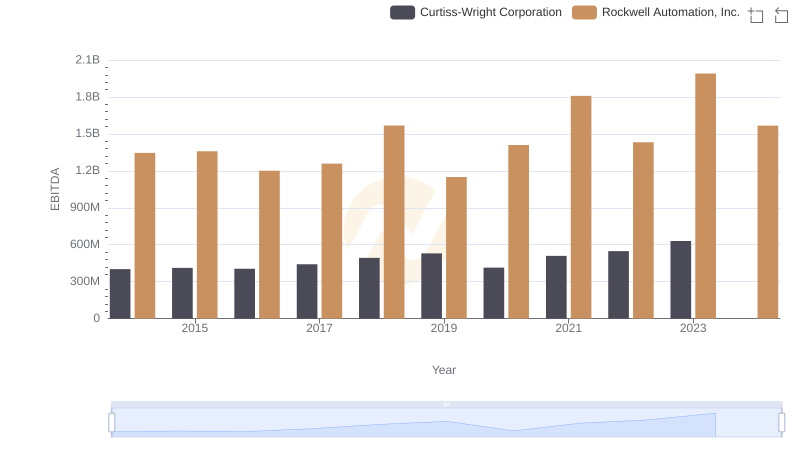
EBITDA Performance Review: Rockwell Automation, Inc. vs Curtiss-Wright Corporation