| __timestamp | Curtiss-Wright Corporation | Rockwell Automation, Inc. |
|---|---|---|
| Wednesday, January 1, 2014 | 401669000 | 1346000000 |
| Thursday, January 1, 2015 | 412042000 | 1359100000 |
| Friday, January 1, 2016 | 405217000 | 1200700000 |
| Sunday, January 1, 2017 | 441085000 | 1258400000 |
| Monday, January 1, 2018 | 493171000 | 1568400000 |
| Tuesday, January 1, 2019 | 530221000 | 1150200000 |
| Wednesday, January 1, 2020 | 414499000 | 1410200000 |
| Friday, January 1, 2021 | 509134000 | 1808300000 |
| Saturday, January 1, 2022 | 548202000 | 1432100000 |
| Sunday, January 1, 2023 | 630635000 | 1990700000 |
| Monday, January 1, 2024 | 674592000 | 1567500000 |
Infusing magic into the data realm
In the ever-evolving landscape of industrial automation and aerospace, Rockwell Automation, Inc. and Curtiss-Wright Corporation have been pivotal players. Over the past decade, Rockwell Automation has consistently outperformed Curtiss-Wright in terms of EBITDA, showcasing a robust growth trajectory. From 2014 to 2023, Rockwell's EBITDA surged by approximately 48%, peaking in 2023, while Curtiss-Wright's EBITDA grew by about 57% over the same period, reaching its zenith in 2023.
Despite Curtiss-Wright's impressive growth rate, Rockwell's EBITDA figures have remained significantly higher, reflecting its dominant market position. The data reveals a compelling narrative of industrial giants navigating economic shifts and technological advancements. Notably, the absence of Curtiss-Wright's 2024 data suggests potential challenges or strategic shifts. As we look to the future, these trends offer valuable insights into the competitive dynamics of the industrial sector.

Breaking Down Revenue Trends: Rockwell Automation, Inc. vs Curtiss-Wright Corporation
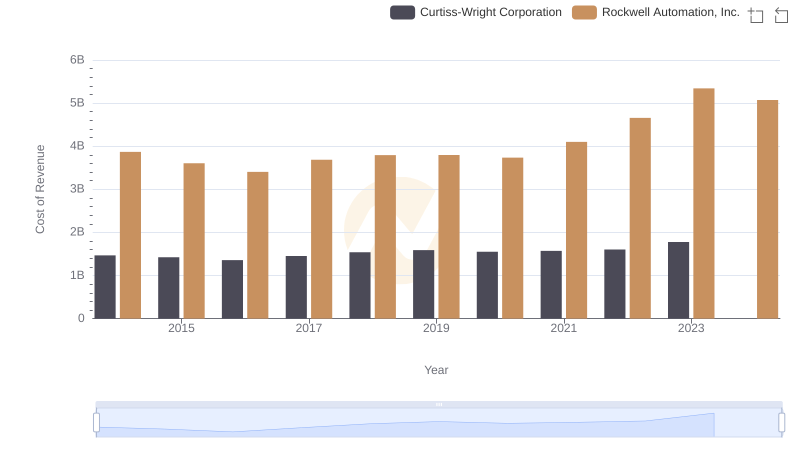
Cost of Revenue Trends: Rockwell Automation, Inc. vs Curtiss-Wright Corporation
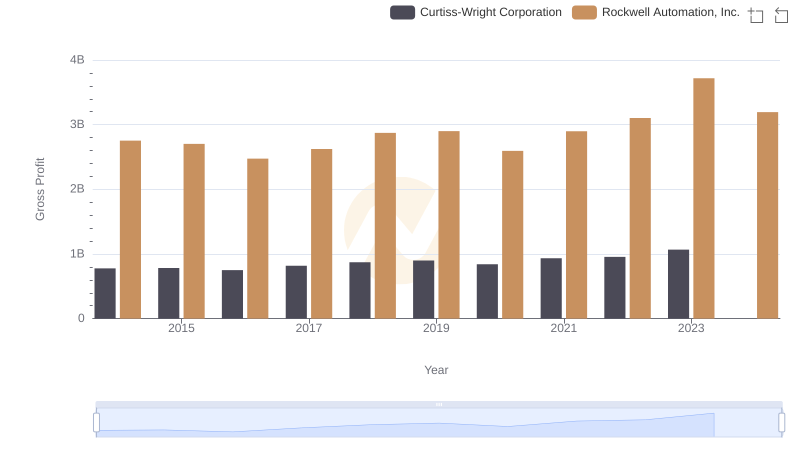
Rockwell Automation, Inc. and Curtiss-Wright Corporation: A Detailed Gross Profit Analysis
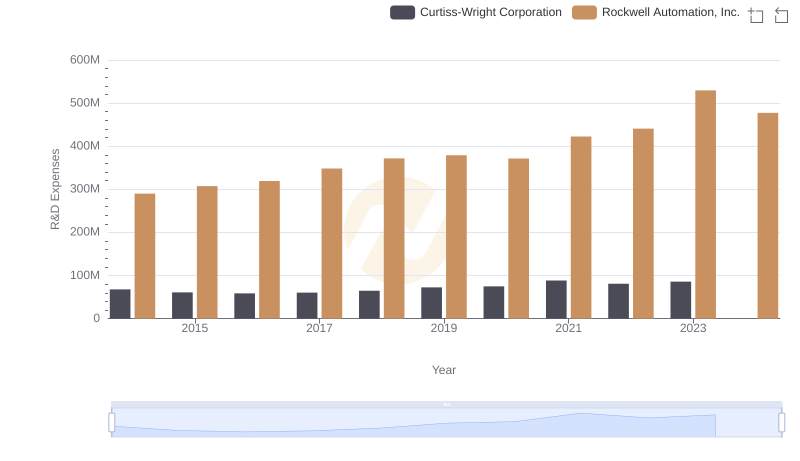
R&D Spending Showdown: Rockwell Automation, Inc. vs Curtiss-Wright Corporation
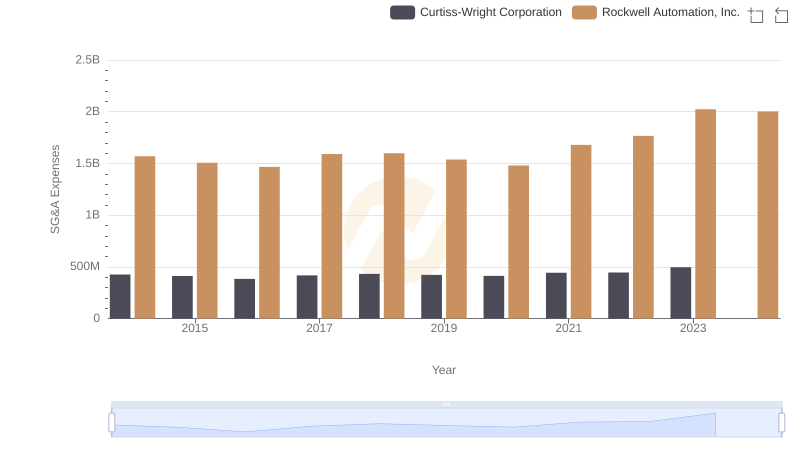
Comparing SG&A Expenses: Rockwell Automation, Inc. vs Curtiss-Wright Corporation Trends and Insights
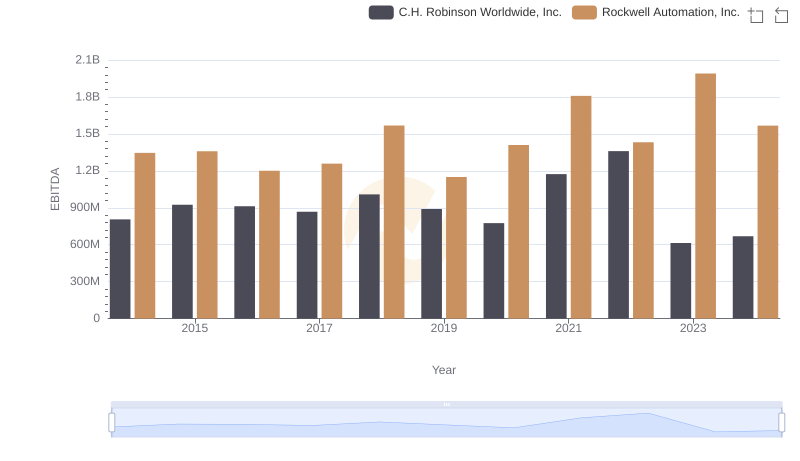
Rockwell Automation, Inc. and C.H. Robinson Worldwide, Inc.: A Detailed Examination of EBITDA Performance
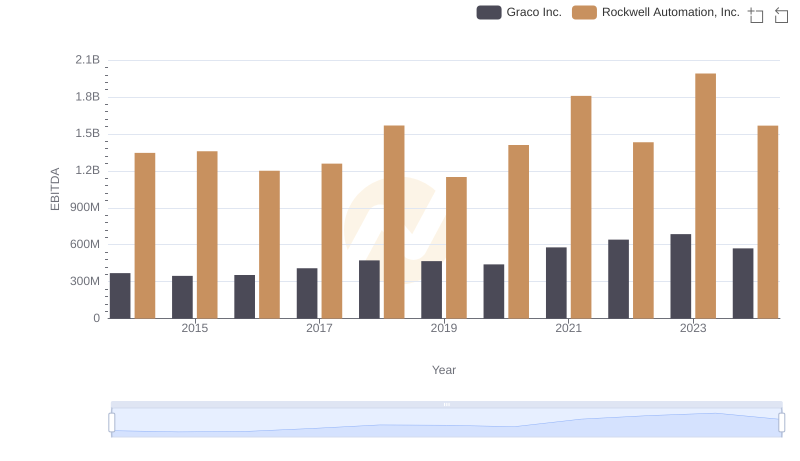
A Side-by-Side Analysis of EBITDA: Rockwell Automation, Inc. and Graco Inc.
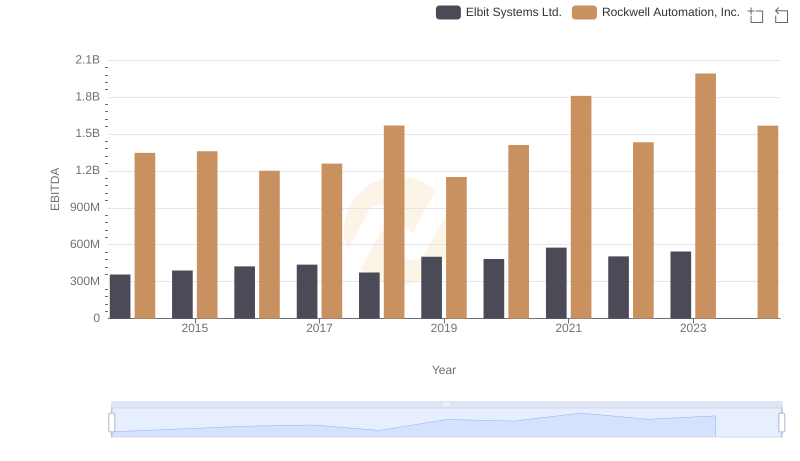
EBITDA Performance Review: Rockwell Automation, Inc. vs Elbit Systems Ltd.
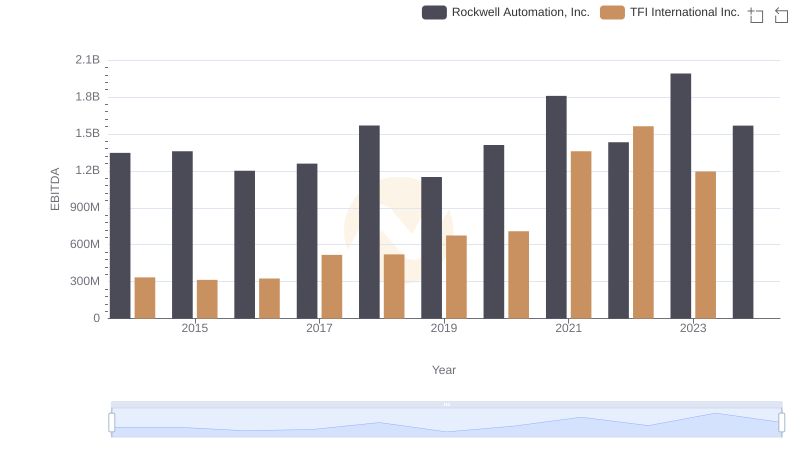
A Side-by-Side Analysis of EBITDA: Rockwell Automation, Inc. and TFI International Inc.
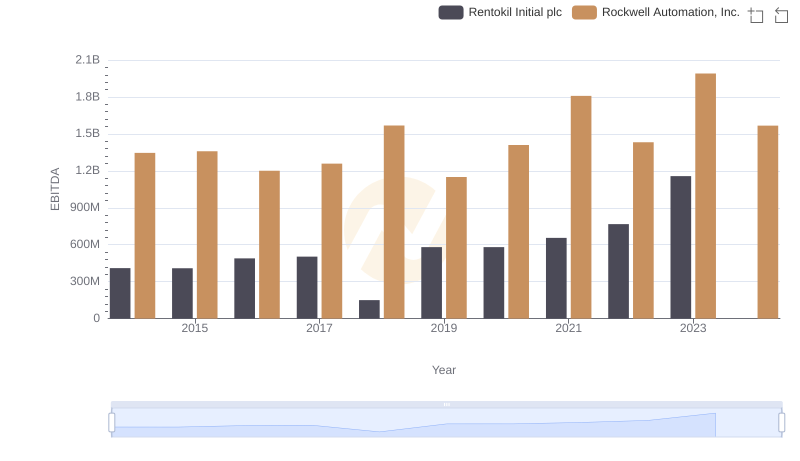
EBITDA Metrics Evaluated: Rockwell Automation, Inc. vs Rentokil Initial plc
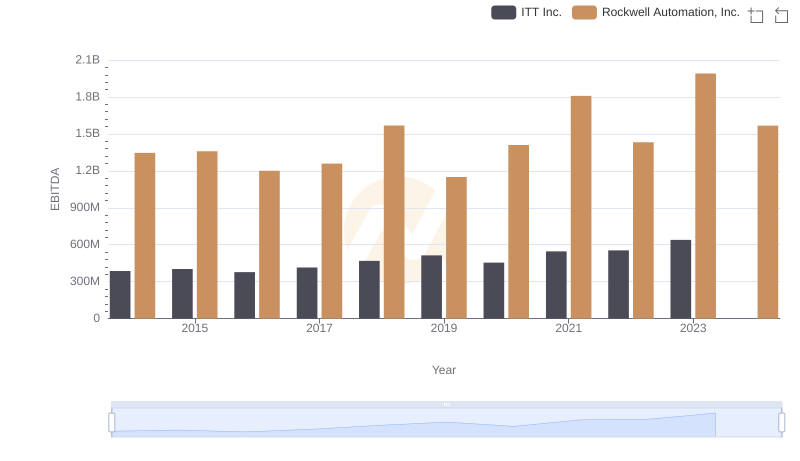
Rockwell Automation, Inc. vs ITT Inc.: In-Depth EBITDA Performance Comparison