| __timestamp | Graco Inc. | Rockwell Automation, Inc. |
|---|---|---|
| Wednesday, January 1, 2014 | 369321000 | 1346000000 |
| Thursday, January 1, 2015 | 346732000 | 1359100000 |
| Friday, January 1, 2016 | 354454000 | 1200700000 |
| Sunday, January 1, 2017 | 408879000 | 1258400000 |
| Monday, January 1, 2018 | 472905000 | 1568400000 |
| Tuesday, January 1, 2019 | 466687000 | 1150200000 |
| Wednesday, January 1, 2020 | 440431000 | 1410200000 |
| Friday, January 1, 2021 | 578005000 | 1808300000 |
| Saturday, January 1, 2022 | 641618000 | 1432100000 |
| Sunday, January 1, 2023 | 686593000 | 1990700000 |
| Monday, January 1, 2024 | 570098000 | 1567500000 |
Unlocking the unknown
In the ever-evolving landscape of industrial automation and manufacturing, Rockwell Automation, Inc. and Graco Inc. have emerged as key players. Over the past decade, these companies have demonstrated significant growth in their Earnings Before Interest, Taxes, Depreciation, and Amortization (EBITDA), a crucial indicator of financial health and operational efficiency.
From 2014 to 2023, Rockwell Automation's EBITDA surged by approximately 48%, peaking in 2023. Meanwhile, Graco Inc. exhibited a remarkable 86% increase, highlighting its robust growth trajectory. Notably, 2021 marked a pivotal year for both companies, with Graco achieving a 24% rise in EBITDA, while Rockwell Automation saw a 29% increase.
This side-by-side analysis underscores the dynamic nature of the industrial sector, where strategic investments and innovation drive financial performance. As we look to the future, these trends offer valuable insights for investors and industry stakeholders alike.
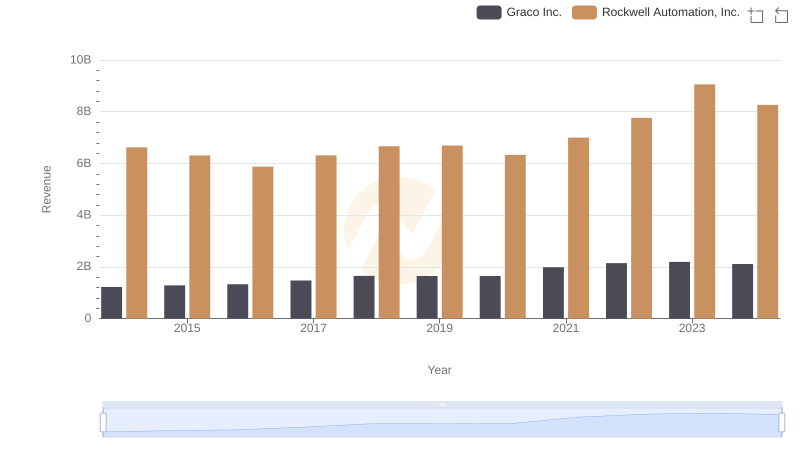
Rockwell Automation, Inc. vs Graco Inc.: Examining Key Revenue Metrics
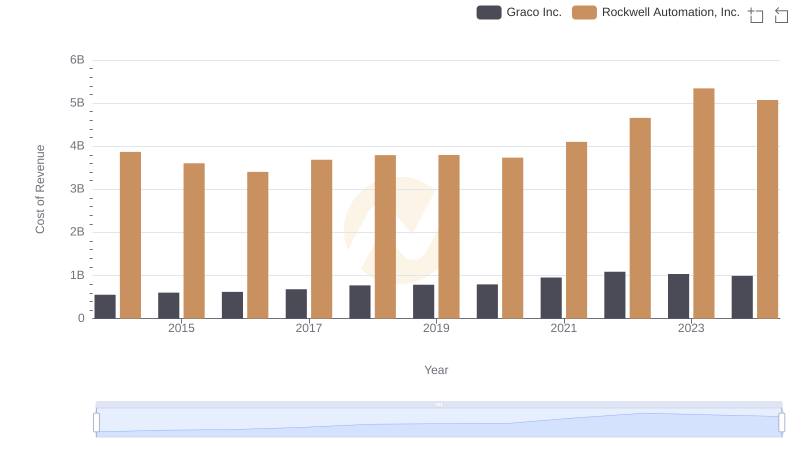
Cost Insights: Breaking Down Rockwell Automation, Inc. and Graco Inc.'s Expenses
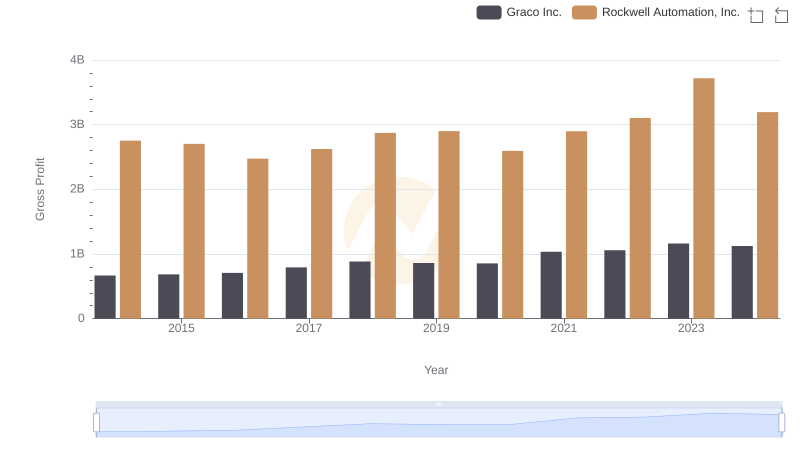
Gross Profit Trends Compared: Rockwell Automation, Inc. vs Graco Inc.
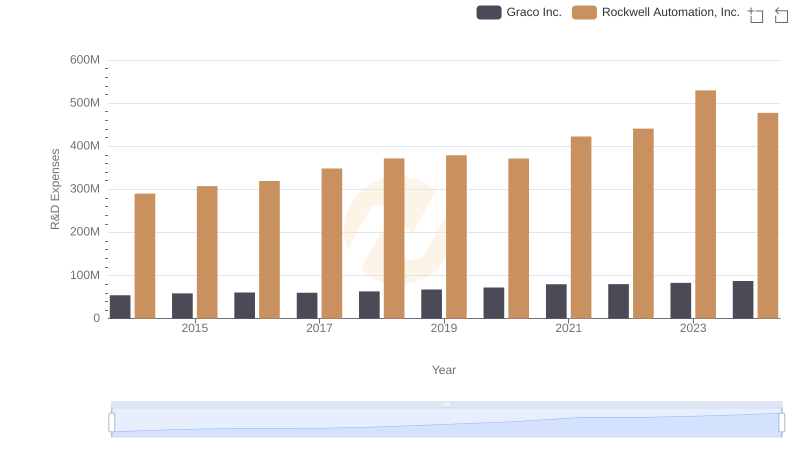
Research and Development Expenses Breakdown: Rockwell Automation, Inc. vs Graco Inc.
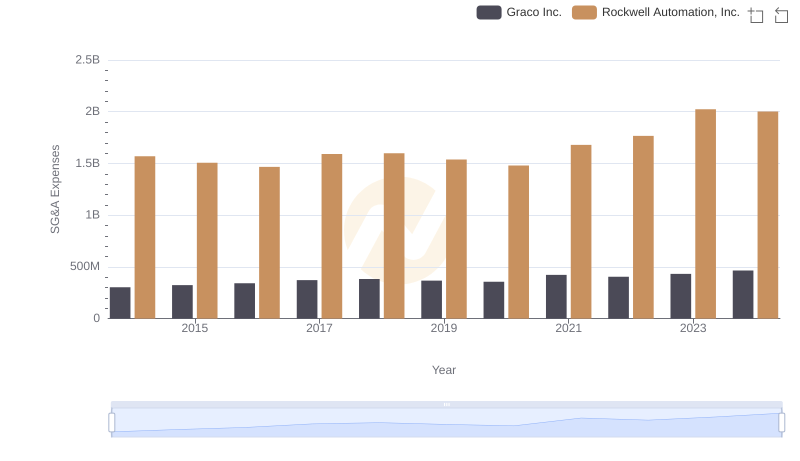
Rockwell Automation, Inc. and Graco Inc.: SG&A Spending Patterns Compared
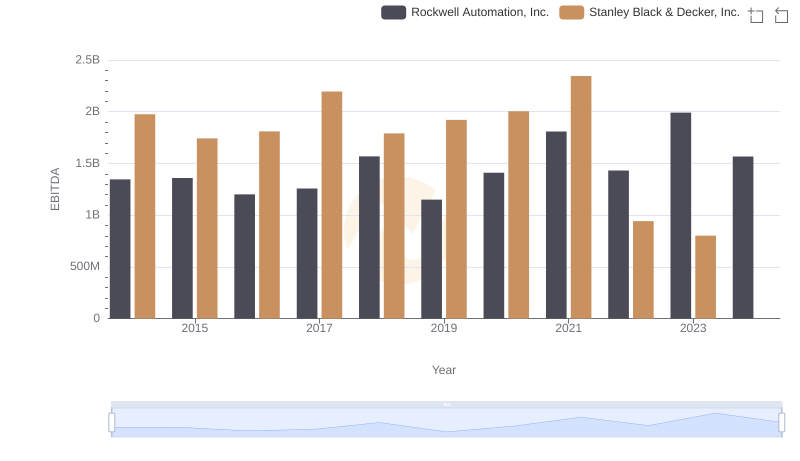
Comprehensive EBITDA Comparison: Rockwell Automation, Inc. vs Stanley Black & Decker, Inc.
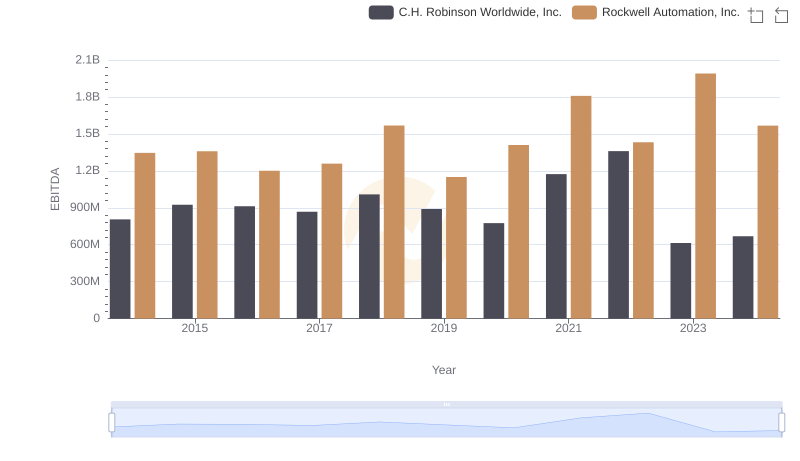
Rockwell Automation, Inc. and C.H. Robinson Worldwide, Inc.: A Detailed Examination of EBITDA Performance
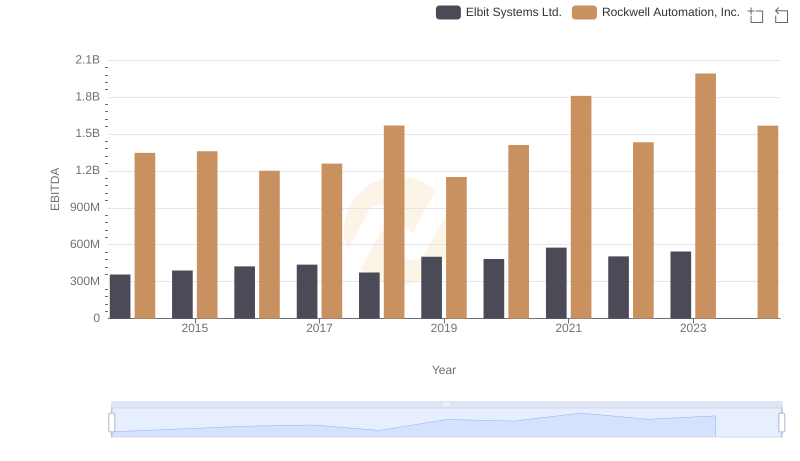
EBITDA Performance Review: Rockwell Automation, Inc. vs Elbit Systems Ltd.
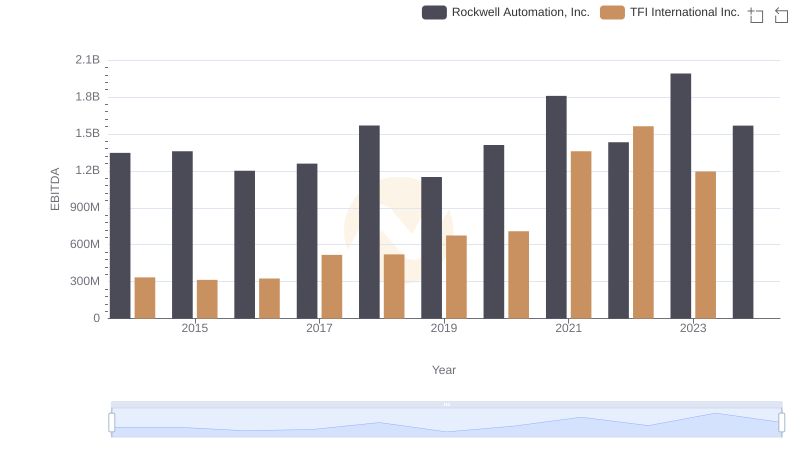
A Side-by-Side Analysis of EBITDA: Rockwell Automation, Inc. and TFI International Inc.
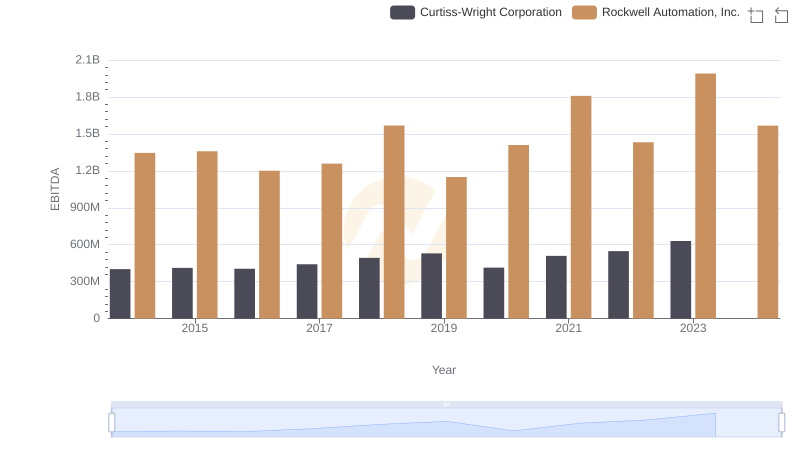
EBITDA Performance Review: Rockwell Automation, Inc. vs Curtiss-Wright Corporation