| __timestamp | Rockwell Automation, Inc. | Stanley Black & Decker, Inc. |
|---|---|---|
| Wednesday, January 1, 2014 | 1346000000 | 1975400000 |
| Thursday, January 1, 2015 | 1359100000 | 1741900000 |
| Friday, January 1, 2016 | 1200700000 | 1810200000 |
| Sunday, January 1, 2017 | 1258400000 | 2196000000 |
| Monday, January 1, 2018 | 1568400000 | 1791200000 |
| Tuesday, January 1, 2019 | 1150200000 | 1920600000 |
| Wednesday, January 1, 2020 | 1410200000 | 2004200000 |
| Friday, January 1, 2021 | 1808300000 | 2345500000 |
| Saturday, January 1, 2022 | 1432100000 | 942800000 |
| Sunday, January 1, 2023 | 1990700000 | 802700000 |
| Monday, January 1, 2024 | 1567500000 | 286300000 |
Unlocking the unknown
In the ever-evolving landscape of industrial automation and tools, Rockwell Automation and Stanley Black & Decker have been pivotal players. Over the past decade, from 2014 to 2023, these giants have showcased intriguing trends in their EBITDA performance. Rockwell Automation's EBITDA has seen a steady climb, peaking in 2023 with a remarkable 47% increase from its 2014 figures. Meanwhile, Stanley Black & Decker experienced a more volatile journey, with a significant dip in 2022, marking a 52% decrease from its 2021 peak.
This comparison highlights the resilience and strategic maneuvers of Rockwell Automation, especially in the face of global economic shifts. On the other hand, Stanley Black & Decker's recent downturn suggests potential challenges or strategic pivots. As we look to the future, the missing data for 2024 leaves room for speculation and anticipation in the industrial sector.
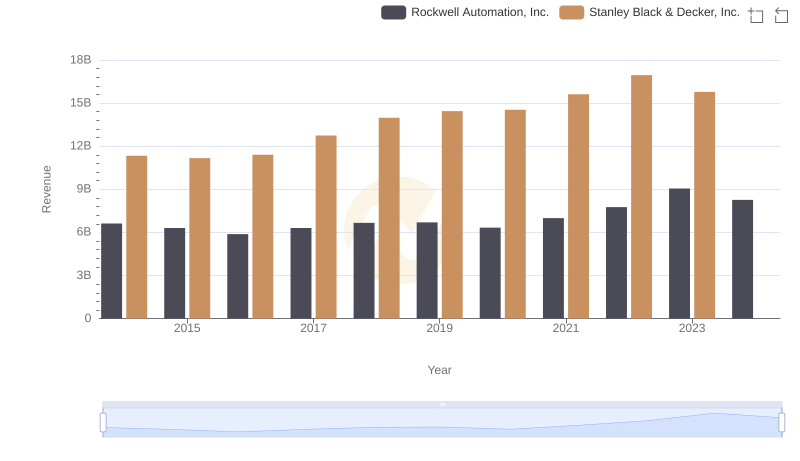
Who Generates More Revenue? Rockwell Automation, Inc. or Stanley Black & Decker, Inc.

Comparing Cost of Revenue Efficiency: Rockwell Automation, Inc. vs Stanley Black & Decker, Inc.

Who Generates Higher Gross Profit? Rockwell Automation, Inc. or Stanley Black & Decker, Inc.
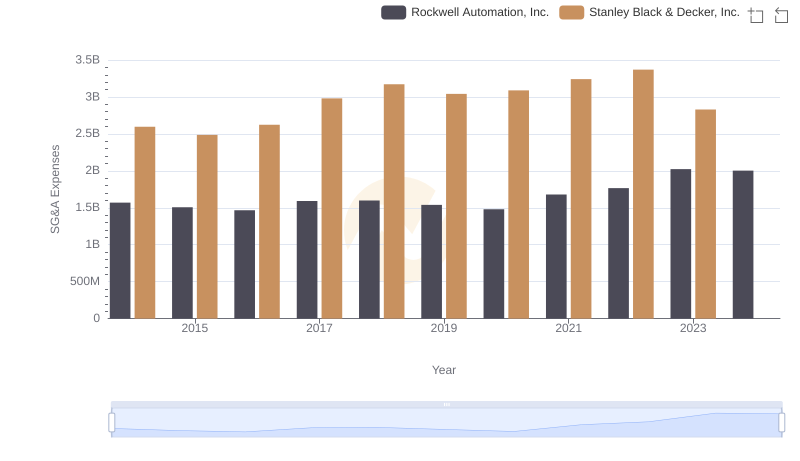
Selling, General, and Administrative Costs: Rockwell Automation, Inc. vs Stanley Black & Decker, Inc.
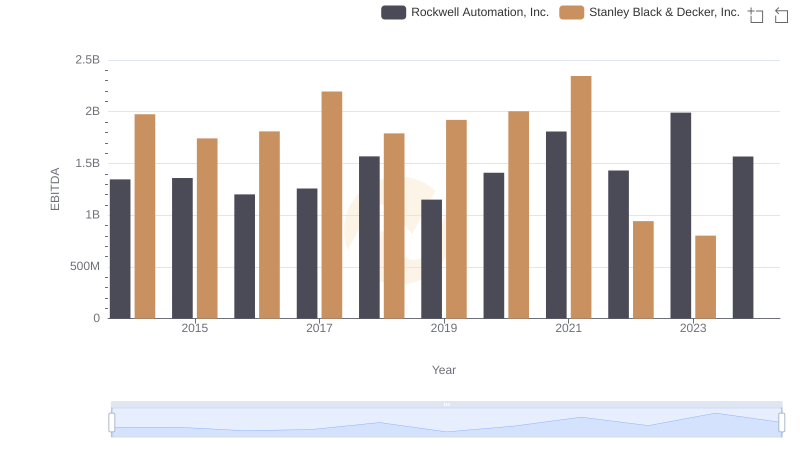
Rockwell Automation, Inc. and Stanley Black & Decker, Inc.: A Detailed Examination of EBITDA Performance
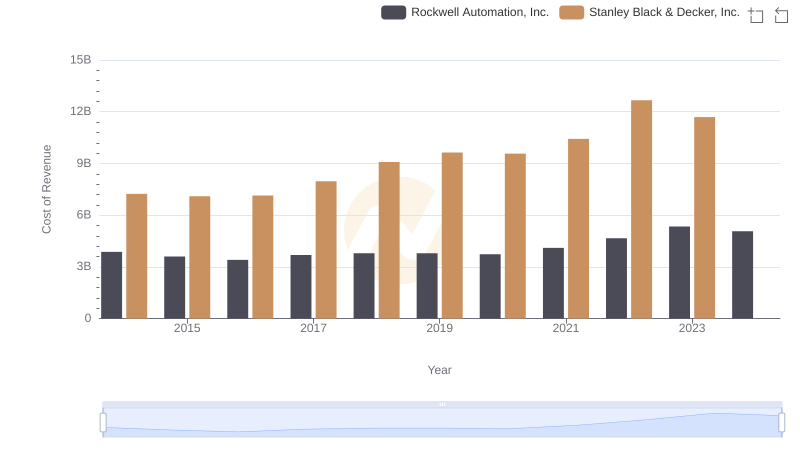
Rockwell Automation, Inc. vs Stanley Black & Decker, Inc.: Efficiency in Cost of Revenue Explored
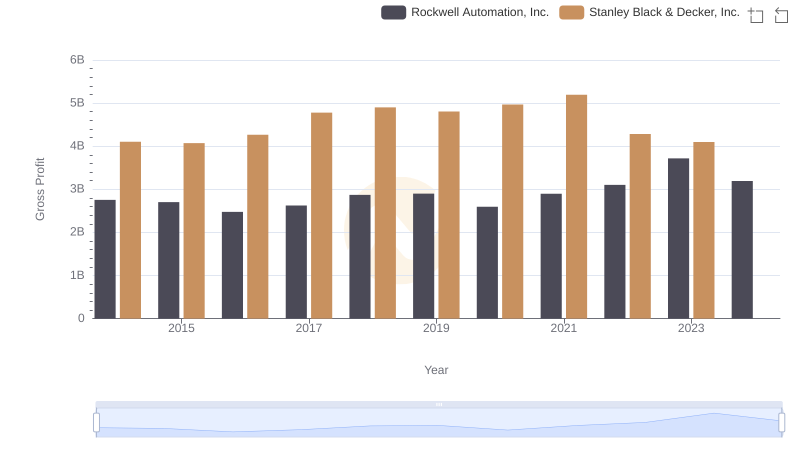
Who Generates Higher Gross Profit? Rockwell Automation, Inc. or Stanley Black & Decker, Inc.
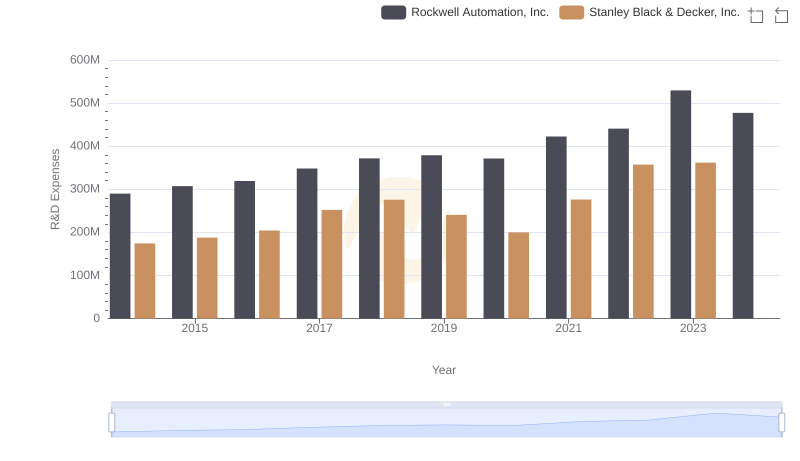
Rockwell Automation, Inc. or Stanley Black & Decker, Inc.: Who Invests More in Innovation?

Who Optimizes SG&A Costs Better? Rockwell Automation, Inc. or Stanley Black & Decker, Inc.
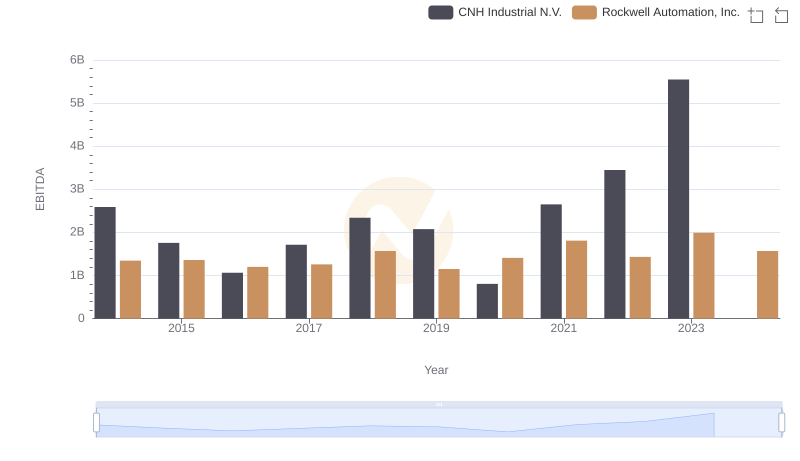
A Side-by-Side Analysis of EBITDA: Rockwell Automation, Inc. and CNH Industrial N.V.