| __timestamp | Elbit Systems Ltd. | Rockwell Automation, Inc. |
|---|---|---|
| Wednesday, January 1, 2014 | 358274000 | 1346000000 |
| Thursday, January 1, 2015 | 390932000 | 1359100000 |
| Friday, January 1, 2016 | 424003291 | 1200700000 |
| Sunday, January 1, 2017 | 438616108 | 1258400000 |
| Monday, January 1, 2018 | 374866620 | 1568400000 |
| Tuesday, January 1, 2019 | 502866000 | 1150200000 |
| Wednesday, January 1, 2020 | 484464000 | 1410200000 |
| Friday, January 1, 2021 | 576645646 | 1808300000 |
| Saturday, January 1, 2022 | 505269000 | 1432100000 |
| Sunday, January 1, 2023 | 544811000 | 1990700000 |
| Monday, January 1, 2024 | 1567500000 |
Unlocking the unknown
In the ever-evolving landscape of industrial automation and defense technology, Rockwell Automation, Inc. and Elbit Systems Ltd. have showcased remarkable financial trajectories over the past decade. From 2014 to 2023, Rockwell Automation's EBITDA surged by approximately 48%, peaking in 2023 with a notable 1.99 billion. This growth underscores its robust market position and strategic advancements in automation solutions.
Conversely, Elbit Systems Ltd. demonstrated a steady EBITDA increase of around 52% over the same period, reaching its zenith in 2021. Despite a slight dip in 2022, the company rebounded in 2023, reflecting its resilience and adaptability in the defense sector.
While Rockwell Automation consistently outperformed Elbit Systems in absolute EBITDA terms, both companies exemplify strong financial health and strategic foresight, making them key players in their respective industries.
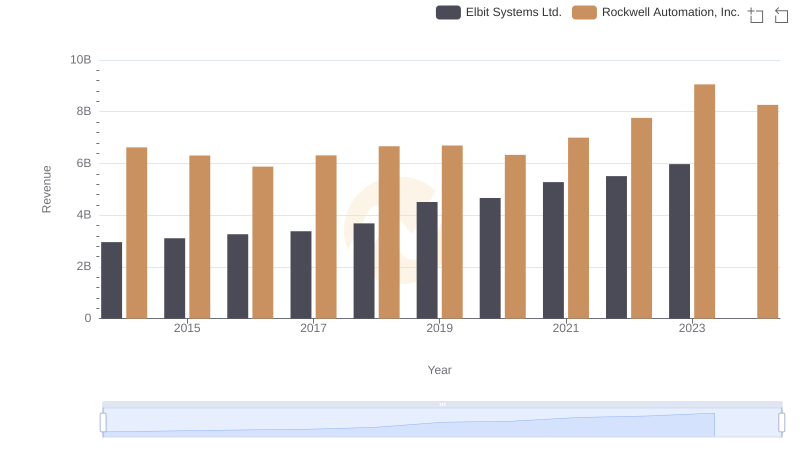
Revenue Showdown: Rockwell Automation, Inc. vs Elbit Systems Ltd.
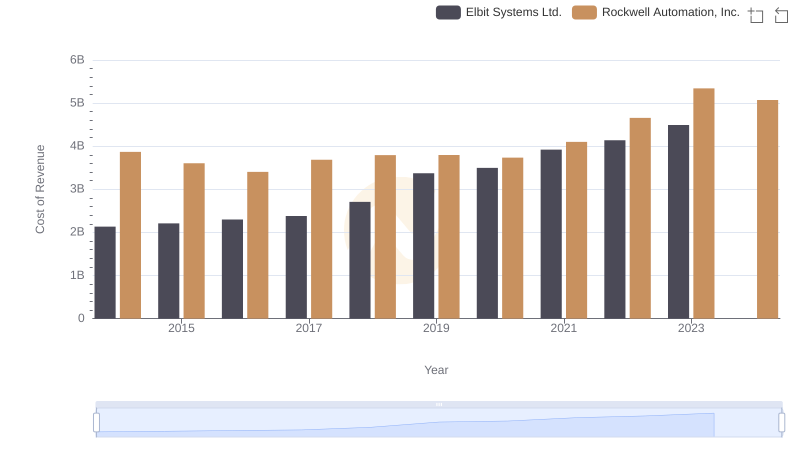
Cost Insights: Breaking Down Rockwell Automation, Inc. and Elbit Systems Ltd.'s Expenses
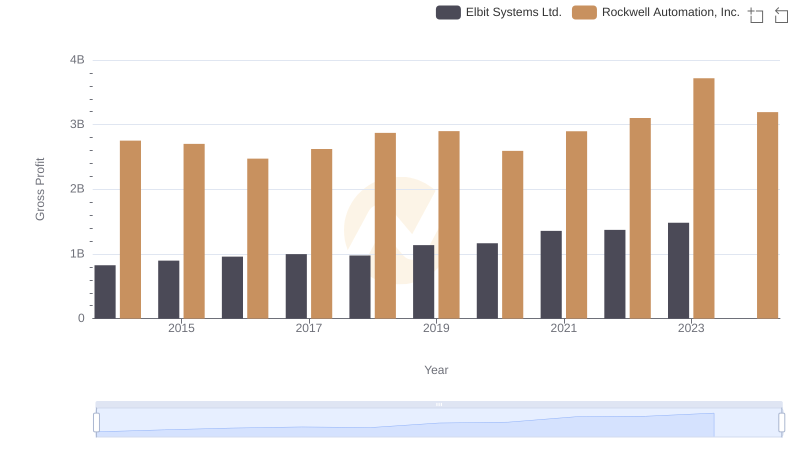
Rockwell Automation, Inc. vs Elbit Systems Ltd.: A Gross Profit Performance Breakdown
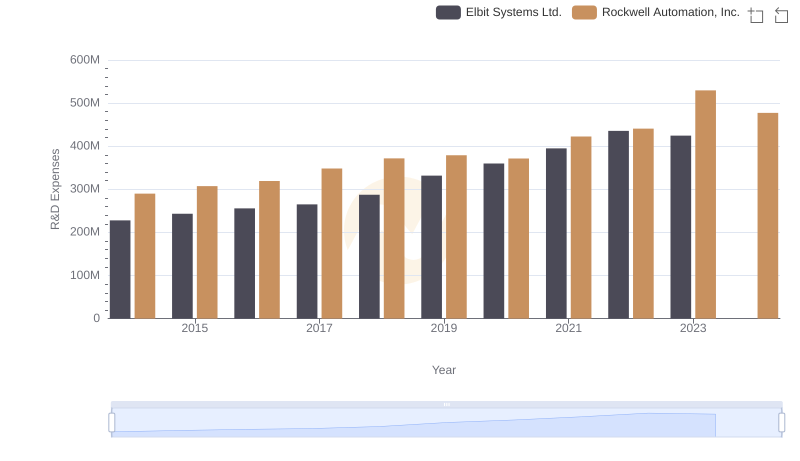
Research and Development Expenses Breakdown: Rockwell Automation, Inc. vs Elbit Systems Ltd.
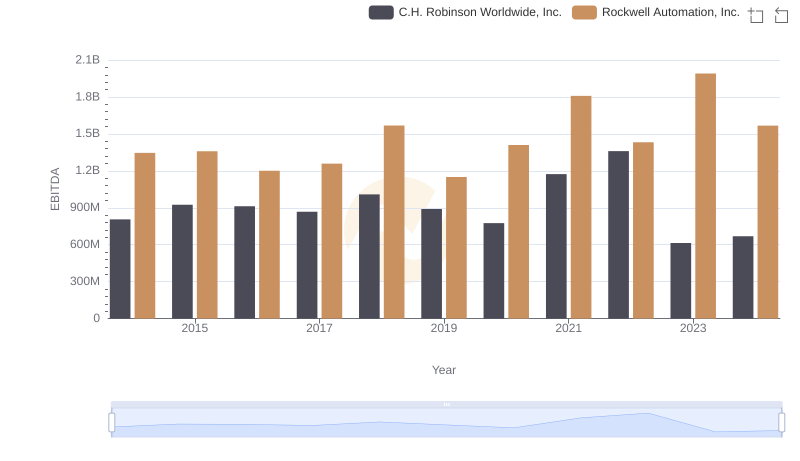
Rockwell Automation, Inc. and C.H. Robinson Worldwide, Inc.: A Detailed Examination of EBITDA Performance
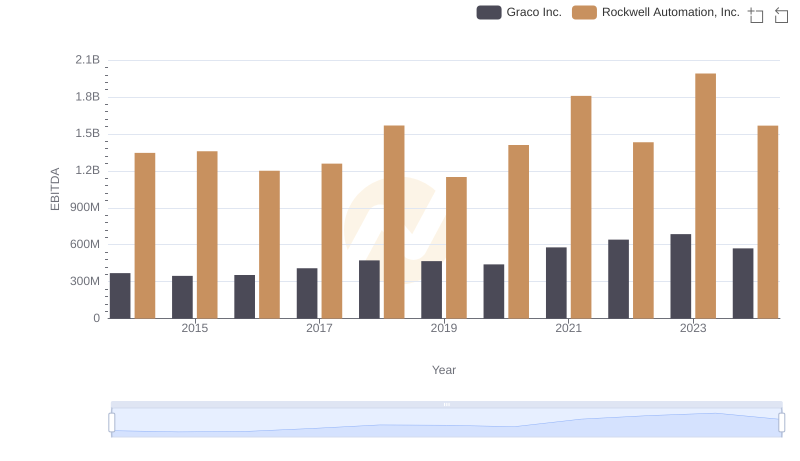
A Side-by-Side Analysis of EBITDA: Rockwell Automation, Inc. and Graco Inc.
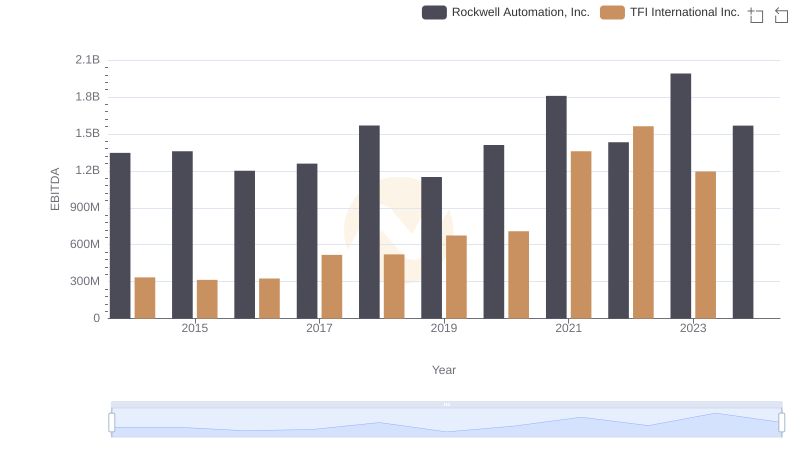
A Side-by-Side Analysis of EBITDA: Rockwell Automation, Inc. and TFI International Inc.
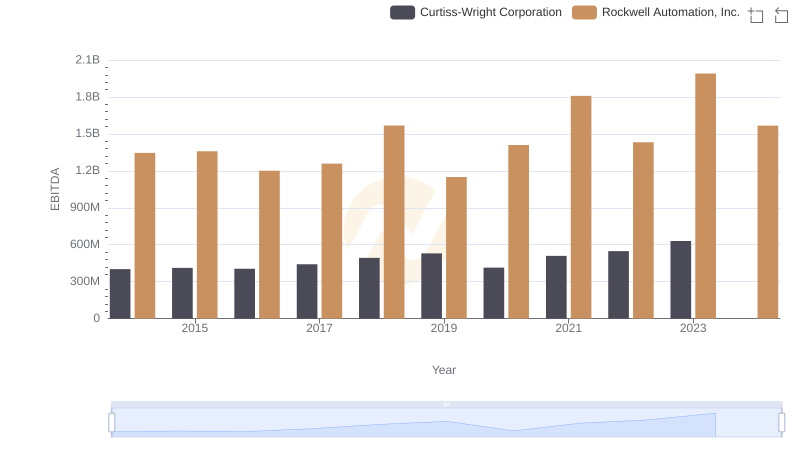
EBITDA Performance Review: Rockwell Automation, Inc. vs Curtiss-Wright Corporation
EBITDA Metrics Evaluated: Rockwell Automation, Inc. vs Rentokil Initial plc