| __timestamp | Global Payments Inc. | Graco Inc. |
|---|---|---|
| Wednesday, January 1, 2014 | 1295014000 | 303565000 |
| Thursday, January 1, 2015 | 1325567000 | 324016000 |
| Friday, January 1, 2016 | 1411096000 | 341734000 |
| Sunday, January 1, 2017 | 1488258000 | 372496000 |
| Monday, January 1, 2018 | 1534297000 | 382988000 |
| Tuesday, January 1, 2019 | 2046672000 | 367743000 |
| Wednesday, January 1, 2020 | 2878878000 | 355796000 |
| Friday, January 1, 2021 | 3391161000 | 422975000 |
| Saturday, January 1, 2022 | 3524578000 | 404731000 |
| Sunday, January 1, 2023 | 4073768000 | 432156000 |
| Monday, January 1, 2024 | 4285307000 | 465133000 |
Unveiling the hidden dimensions of data
In the ever-evolving landscape of corporate finance, understanding the trends in Selling, General, and Administrative (SG&A) expenses is crucial for investors and analysts alike. Over the past decade, Global Payments Inc. and Graco Inc. have showcased contrasting trajectories in their SG&A expenses, reflecting their unique business strategies and market positions.
From 2014 to 2023, Global Payments Inc. experienced a staggering 214% increase in SG&A expenses, peaking in 2023. This growth underscores the company's aggressive expansion and investment in operational capabilities. In contrast, Graco Inc.'s SG&A expenses grew by a modest 42% over the same period, indicating a more conservative approach to cost management.
While Global Payments Inc. faced a data gap in 2024, Graco Inc. continued its steady climb, reaching new heights. These trends offer a window into the strategic priorities of each company, providing valuable insights for stakeholders.
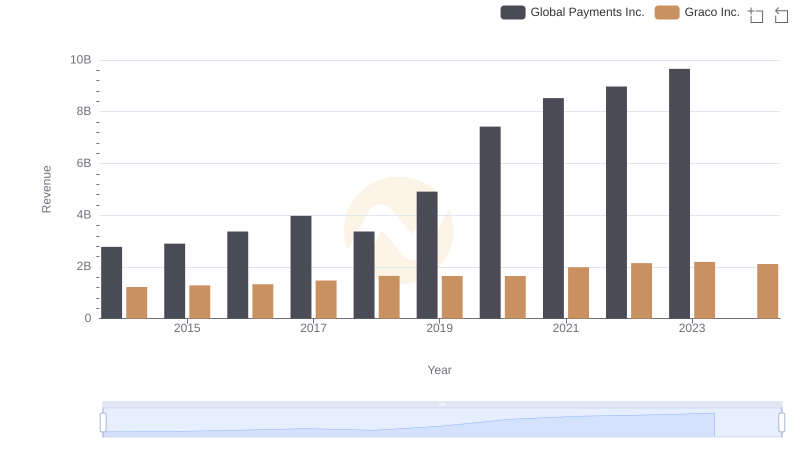
Revenue Showdown: Global Payments Inc. vs Graco Inc.
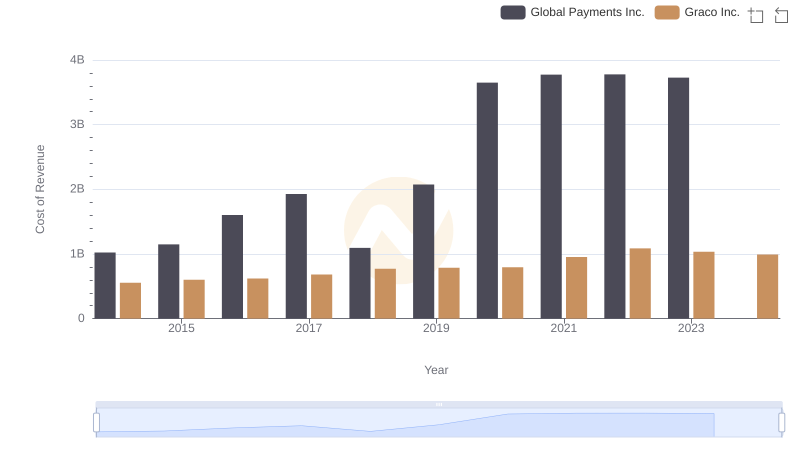
Analyzing Cost of Revenue: Global Payments Inc. and Graco Inc.
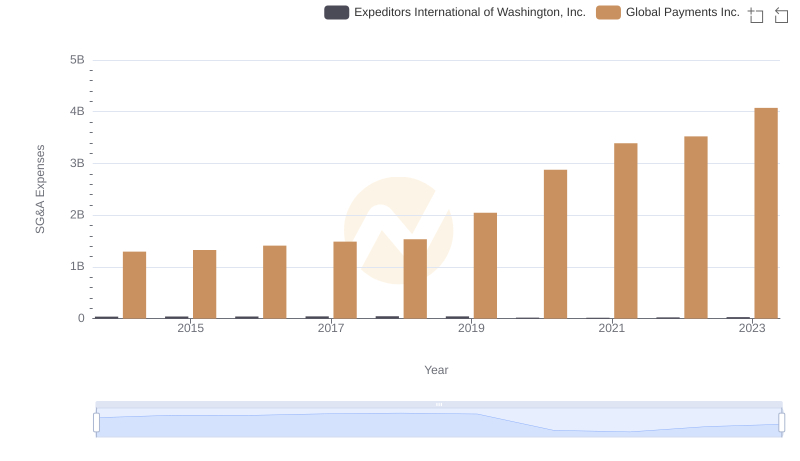
Breaking Down SG&A Expenses: Global Payments Inc. vs Expeditors International of Washington, Inc.
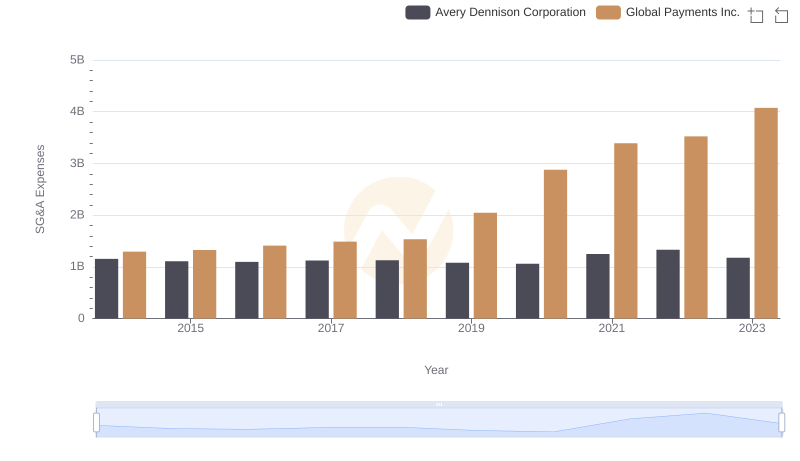
Comparing SG&A Expenses: Global Payments Inc. vs Avery Dennison Corporation Trends and Insights
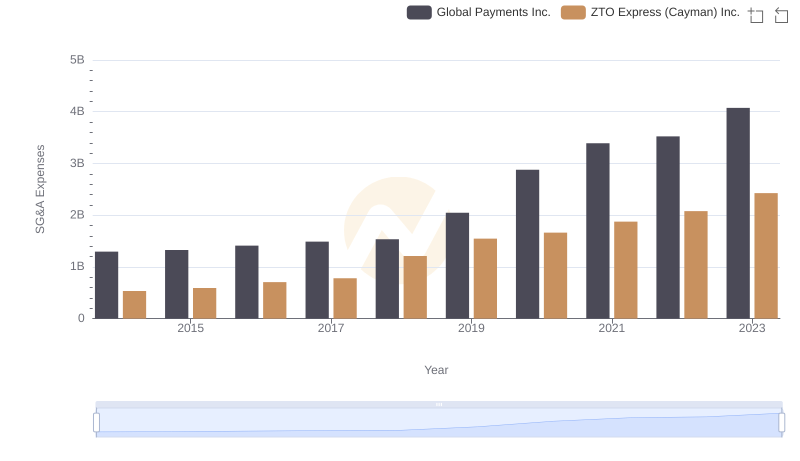
Selling, General, and Administrative Costs: Global Payments Inc. vs ZTO Express (Cayman) Inc.
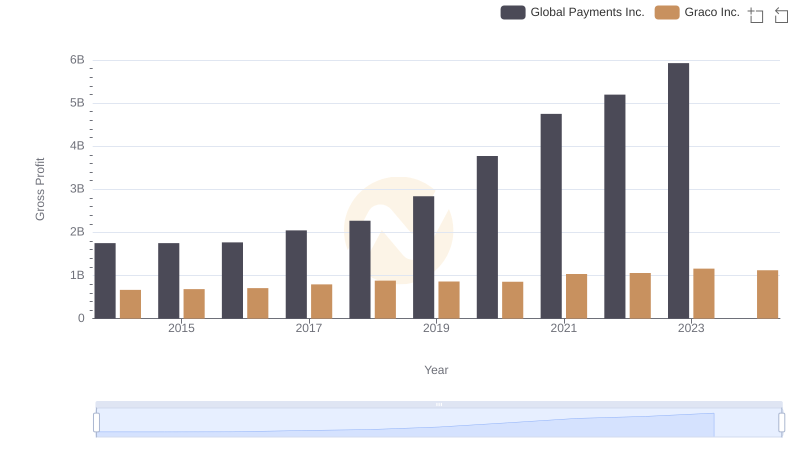
Gross Profit Comparison: Global Payments Inc. and Graco Inc. Trends
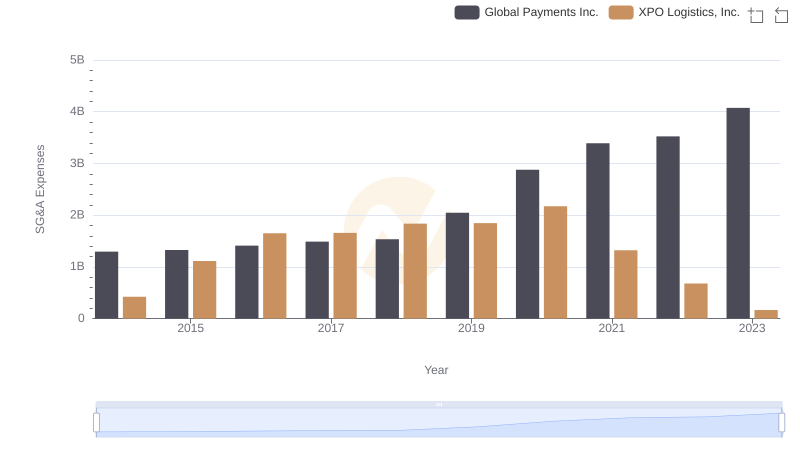
SG&A Efficiency Analysis: Comparing Global Payments Inc. and XPO Logistics, Inc.
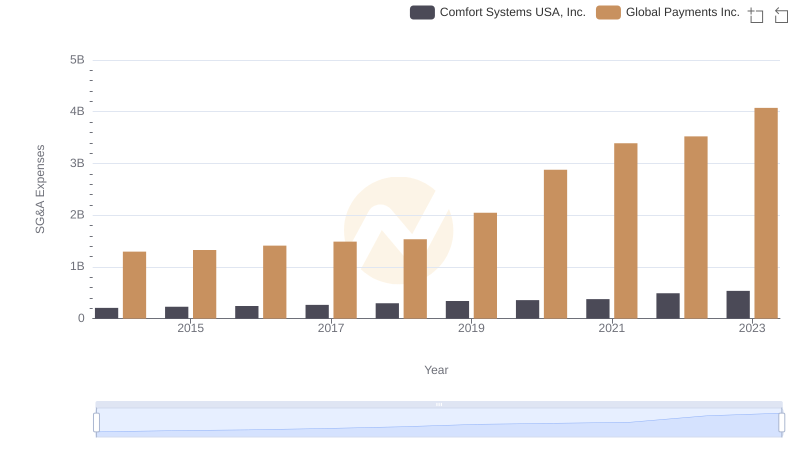
Selling, General, and Administrative Costs: Global Payments Inc. vs Comfort Systems USA, Inc.
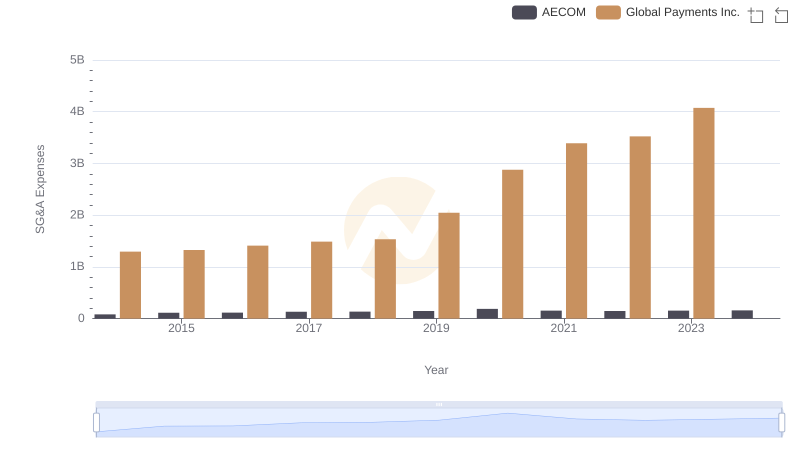
Global Payments Inc. and AECOM: SG&A Spending Patterns Compared
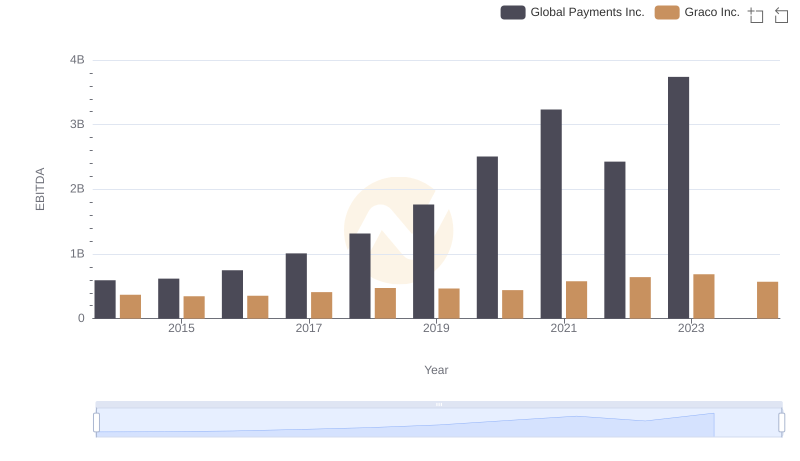
A Side-by-Side Analysis of EBITDA: Global Payments Inc. and Graco Inc.
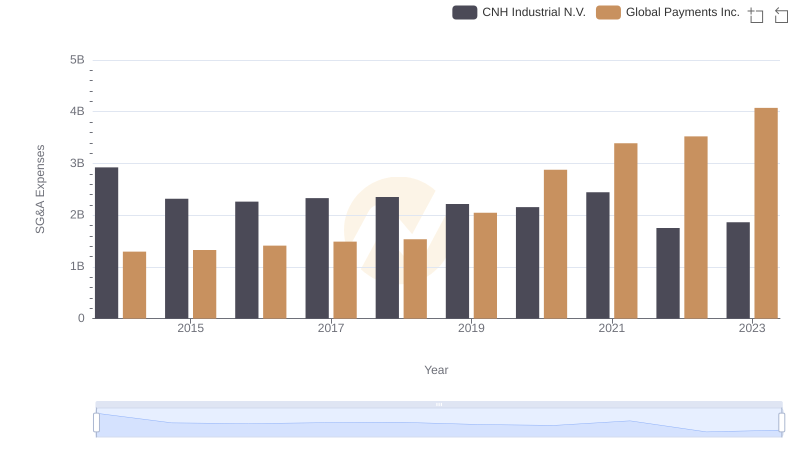
Global Payments Inc. or CNH Industrial N.V.: Who Manages SG&A Costs Better?
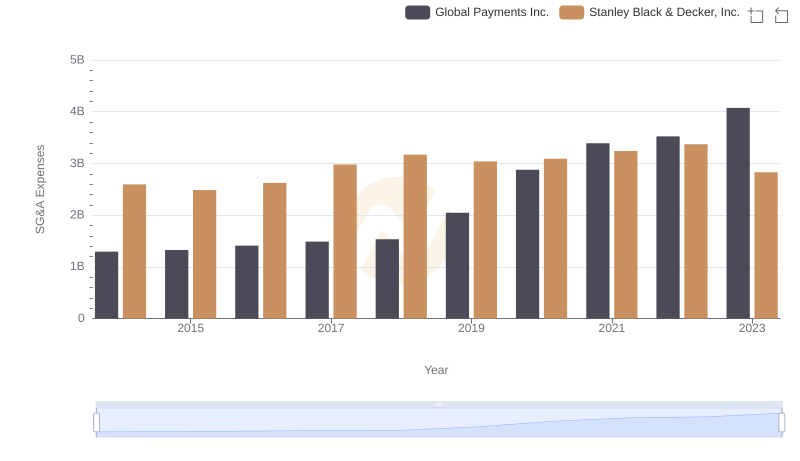
Breaking Down SG&A Expenses: Global Payments Inc. vs Stanley Black & Decker, Inc.