| __timestamp | Global Payments Inc. | Graco Inc. |
|---|---|---|
| Wednesday, January 1, 2014 | 1751611000 | 666736000 |
| Thursday, January 1, 2015 | 1750511000 | 684700000 |
| Friday, January 1, 2016 | 1767444000 | 708239000 |
| Sunday, January 1, 2017 | 2047126000 | 793049000 |
| Monday, January 1, 2018 | 2271352000 | 882539000 |
| Tuesday, January 1, 2019 | 2838089000 | 859756000 |
| Wednesday, January 1, 2020 | 3772831000 | 854937000 |
| Friday, January 1, 2021 | 4750037000 | 1033949000 |
| Saturday, January 1, 2022 | 5196898000 | 1057439000 |
| Sunday, January 1, 2023 | 5926898000 | 1161021000 |
| Monday, January 1, 2024 | 6345778000 | 1122461000 |
Unveiling the hidden dimensions of data
In the ever-evolving landscape of the financial sector, Global Payments Inc. and Graco Inc. have showcased intriguing trajectories in their gross profit margins over the past decade. From 2014 to 2023, Global Payments Inc. has seen a remarkable growth of over 238%, starting from a modest 1.75 billion in 2014 to an impressive 5.93 billion by 2023. This growth underscores the company's strategic expansions and robust market positioning.
Conversely, Graco Inc. has demonstrated steady, albeit more modest, growth. With a 74% increase in gross profit, Graco Inc. rose from 667 million in 2014 to 1.16 billion in 2023. This consistent upward trend highlights Graco's resilience and adaptability in a competitive market.
While Global Payments Inc. experienced a more aggressive growth curve, Graco Inc.'s steady climb reflects its stable market presence. Notably, data for 2024 is incomplete, leaving room for speculation on future trends.
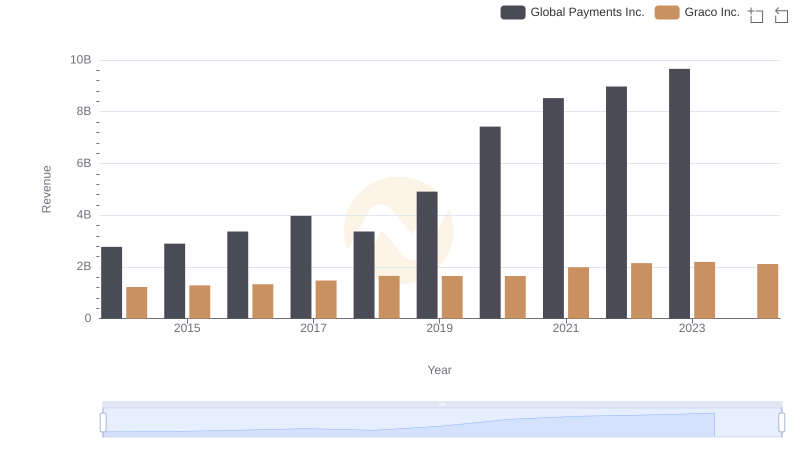
Revenue Showdown: Global Payments Inc. vs Graco Inc.
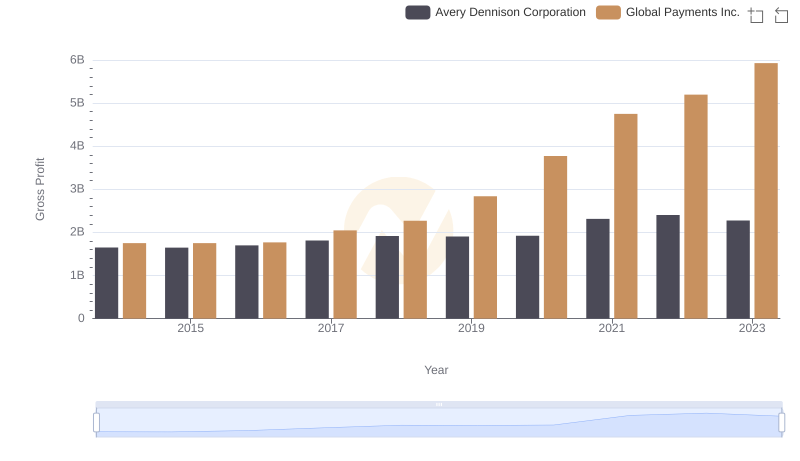
Global Payments Inc. vs Avery Dennison Corporation: A Gross Profit Performance Breakdown
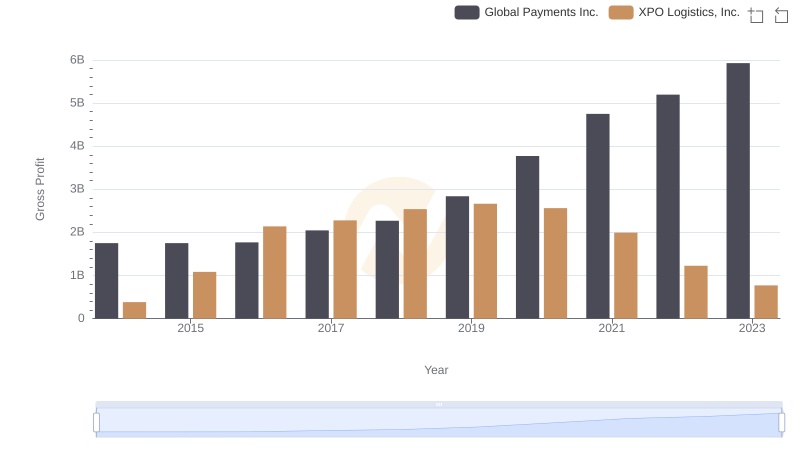
Gross Profit Analysis: Comparing Global Payments Inc. and XPO Logistics, Inc.
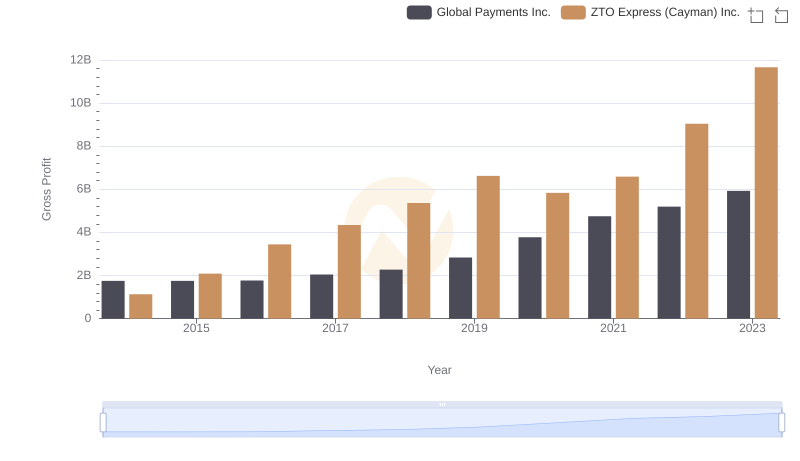
Global Payments Inc. vs ZTO Express (Cayman) Inc.: A Gross Profit Performance Breakdown
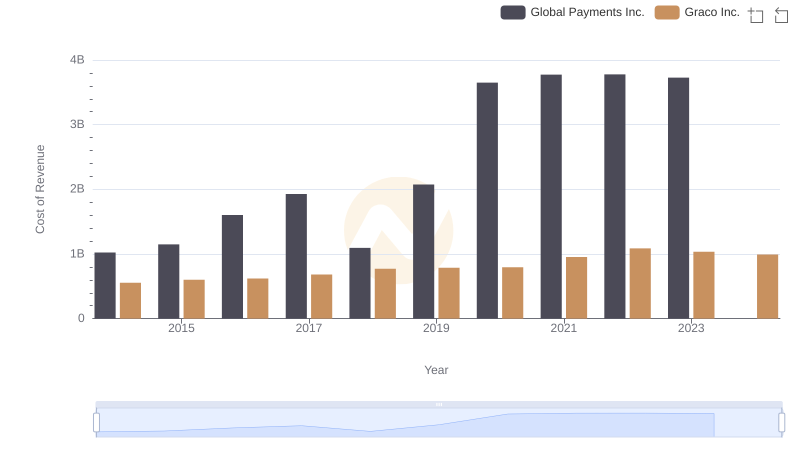
Analyzing Cost of Revenue: Global Payments Inc. and Graco Inc.
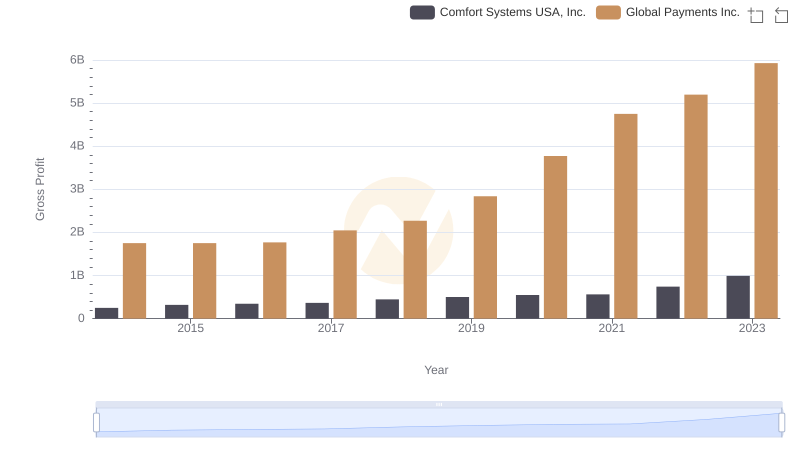
Who Generates Higher Gross Profit? Global Payments Inc. or Comfort Systems USA, Inc.
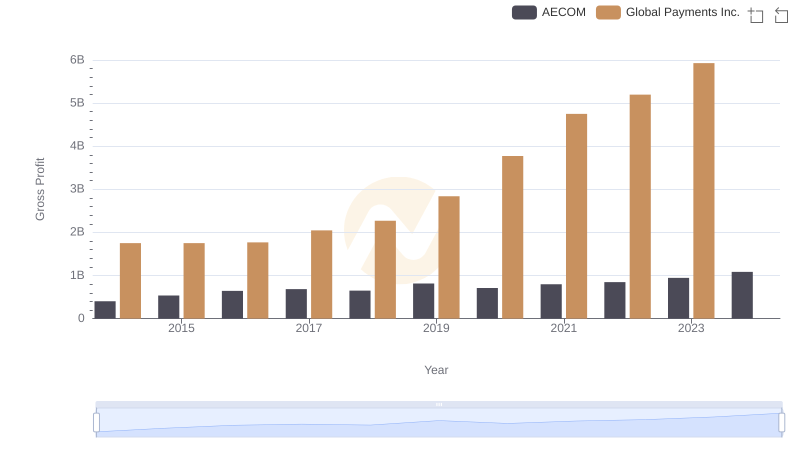
Global Payments Inc. and AECOM: A Detailed Gross Profit Analysis
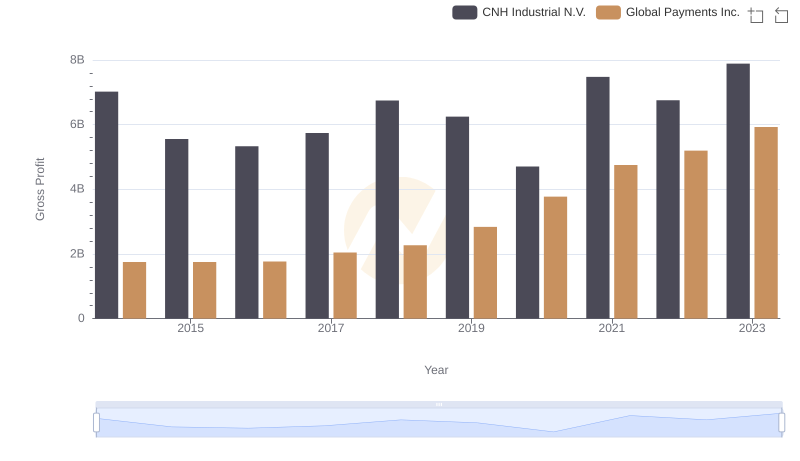
Key Insights on Gross Profit: Global Payments Inc. vs CNH Industrial N.V.
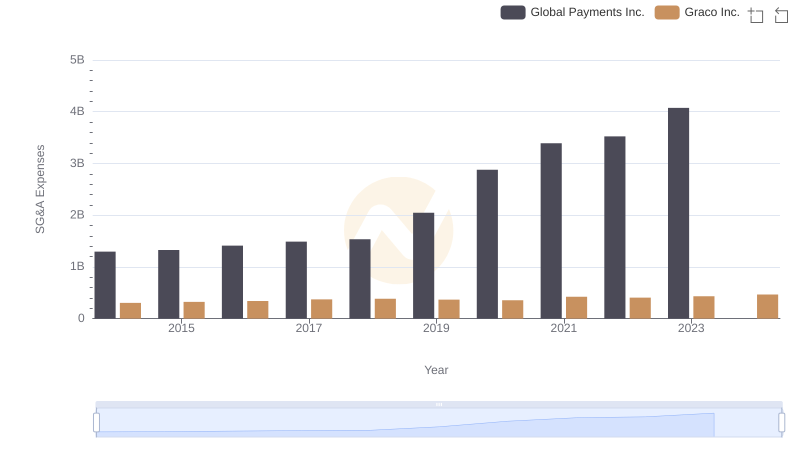
Global Payments Inc. vs Graco Inc.: SG&A Expense Trends

Key Insights on Gross Profit: Global Payments Inc. vs Pool Corporation
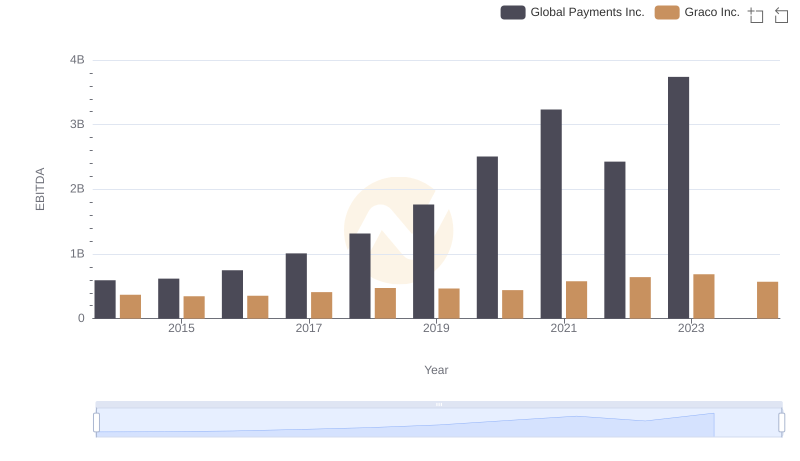
A Side-by-Side Analysis of EBITDA: Global Payments Inc. and Graco Inc.