| __timestamp | Global Payments Inc. | Graco Inc. |
|---|---|---|
| Wednesday, January 1, 2014 | 594102000 | 369321000 |
| Thursday, January 1, 2015 | 618109000 | 346732000 |
| Friday, January 1, 2016 | 748136000 | 354454000 |
| Sunday, January 1, 2017 | 1010019000 | 408879000 |
| Monday, January 1, 2018 | 1315968000 | 472905000 |
| Tuesday, January 1, 2019 | 1764994000 | 466687000 |
| Wednesday, January 1, 2020 | 2508393000 | 440431000 |
| Friday, January 1, 2021 | 3233589000 | 578005000 |
| Saturday, January 1, 2022 | 2427684000 | 641618000 |
| Sunday, January 1, 2023 | 3606789000 | 686593000 |
| Monday, January 1, 2024 | 2333605000 | 570098000 |
In pursuit of knowledge
In the ever-evolving landscape of financial performance, EBITDA serves as a crucial indicator of a company's operational efficiency. This analysis delves into the EBITDA trends of Global Payments Inc. and Graco Inc. from 2014 to 2023. Over this period, Global Payments Inc. has demonstrated a remarkable growth trajectory, with its EBITDA increasing by over 500%, peaking in 2023. In contrast, Graco Inc. has shown a steady yet modest growth of approximately 86% over the same period.
The data reveals that Global Payments Inc. experienced significant growth spurts, particularly between 2019 and 2021, where its EBITDA nearly doubled. Meanwhile, Graco Inc. maintained a consistent upward trend, reflecting its stable market position. Notably, the data for 2024 is incomplete, highlighting the need for ongoing analysis to capture future trends. This side-by-side comparison underscores the dynamic nature of financial performance in the corporate world.
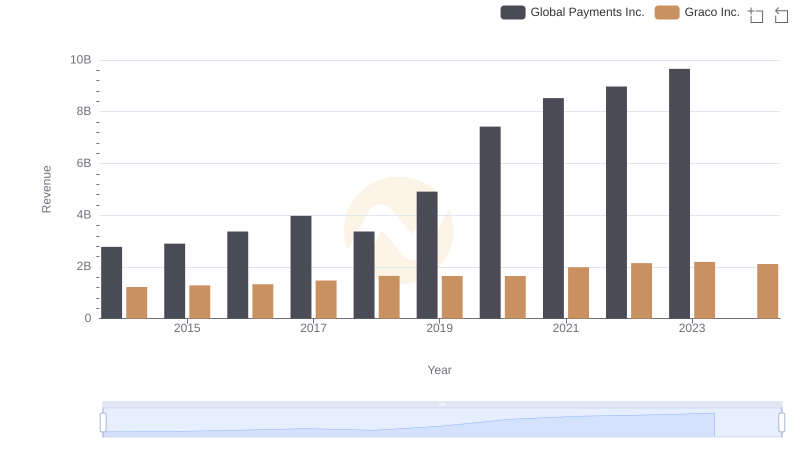
Revenue Showdown: Global Payments Inc. vs Graco Inc.
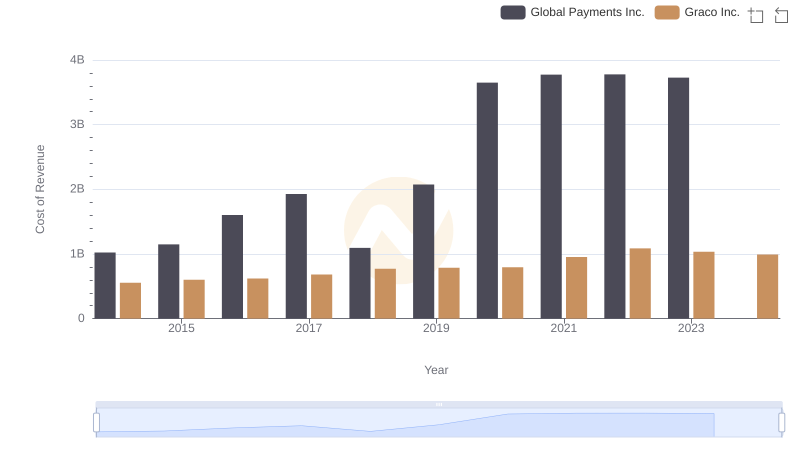
Analyzing Cost of Revenue: Global Payments Inc. and Graco Inc.
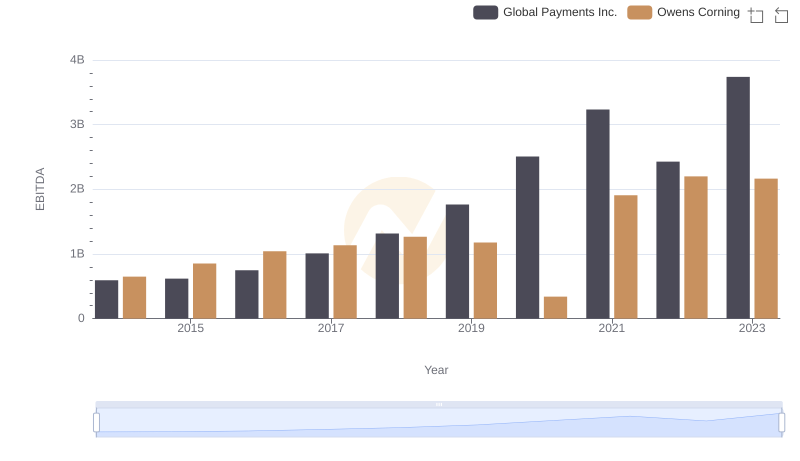
EBITDA Analysis: Evaluating Global Payments Inc. Against Owens Corning
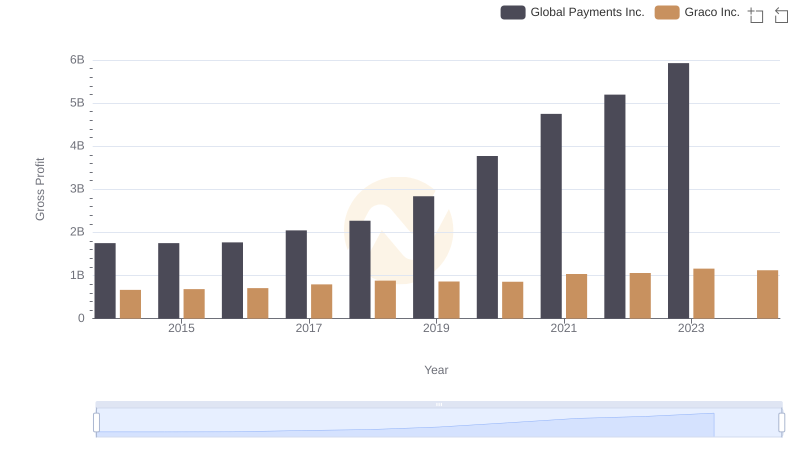
Gross Profit Comparison: Global Payments Inc. and Graco Inc. Trends

Professional EBITDA Benchmarking: Global Payments Inc. vs Expeditors International of Washington, Inc.
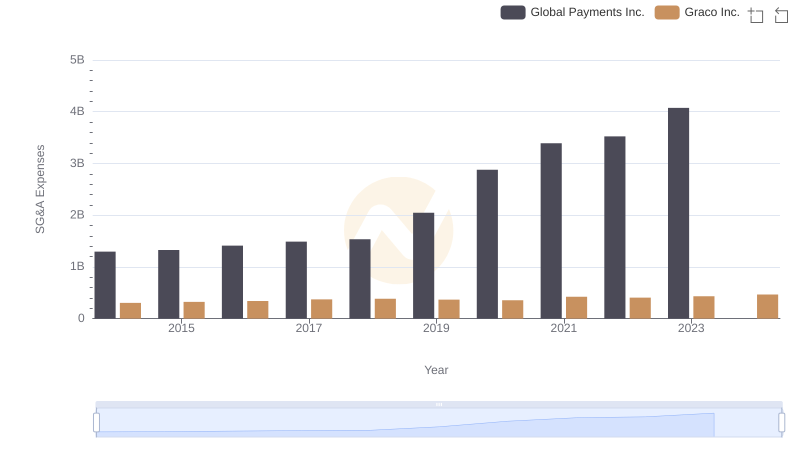
Global Payments Inc. vs Graco Inc.: SG&A Expense Trends
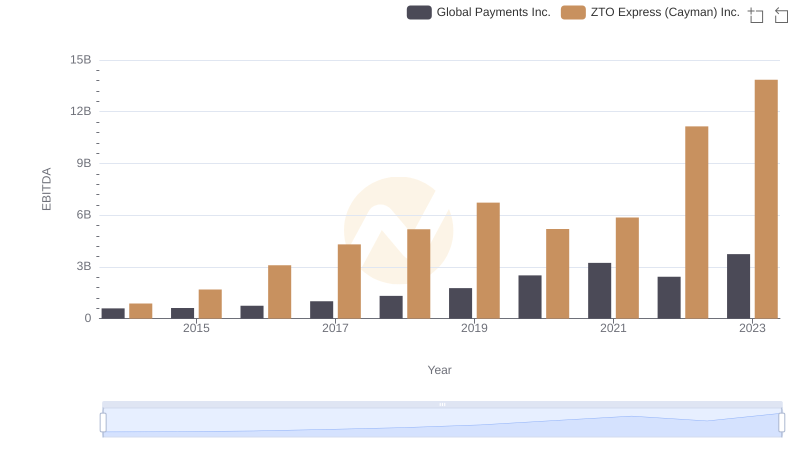
Global Payments Inc. and ZTO Express (Cayman) Inc.: A Detailed Examination of EBITDA Performance

Comprehensive EBITDA Comparison: Global Payments Inc. vs XPO Logistics, Inc.
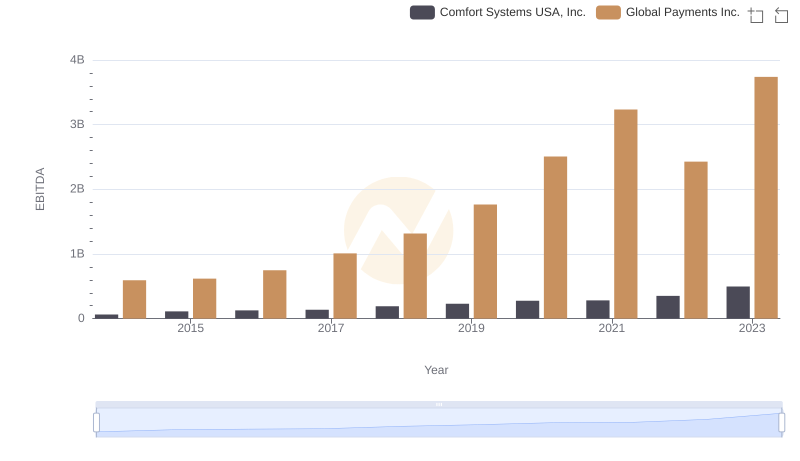
A Side-by-Side Analysis of EBITDA: Global Payments Inc. and Comfort Systems USA, Inc.
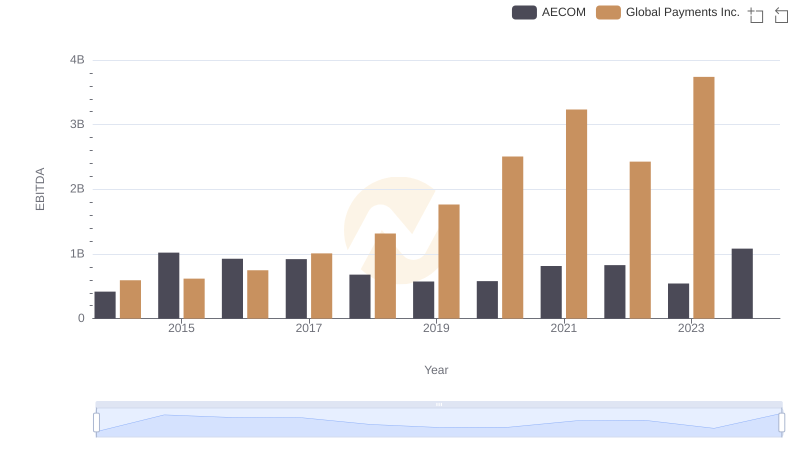
A Professional Review of EBITDA: Global Payments Inc. Compared to AECOM
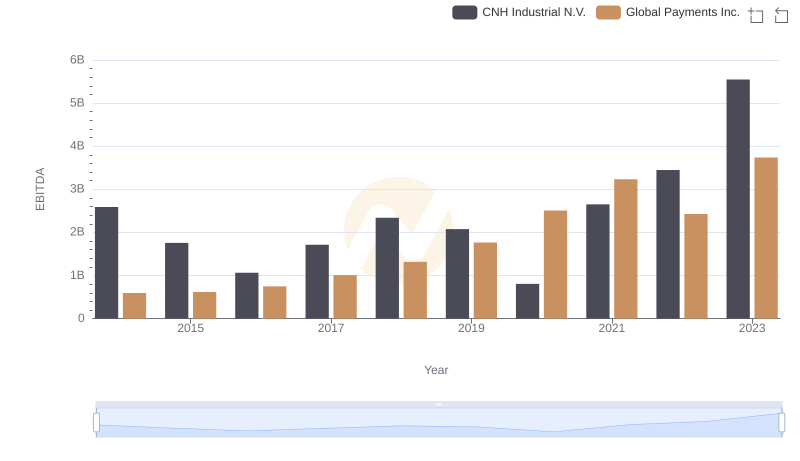
A Side-by-Side Analysis of EBITDA: Global Payments Inc. and CNH Industrial N.V.