| __timestamp | Textron Inc. | United Rentals, Inc. |
|---|---|---|
| Wednesday, January 1, 2014 | 13878000000 | 5685000000 |
| Thursday, January 1, 2015 | 13423000000 | 5817000000 |
| Friday, January 1, 2016 | 13788000000 | 5762000000 |
| Sunday, January 1, 2017 | 14198000000 | 6641000000 |
| Monday, January 1, 2018 | 13972000000 | 8047000000 |
| Tuesday, January 1, 2019 | 13630000000 | 9351000000 |
| Wednesday, January 1, 2020 | 11651000000 | 8530000000 |
| Friday, January 1, 2021 | 12382000000 | 9716000000 |
| Saturday, January 1, 2022 | 12869000000 | 11642000000 |
| Sunday, January 1, 2023 | 13683000000 | 14332000000 |
| Monday, January 1, 2024 | 13702000000 | 15345000000 |
Data in motion
In the competitive landscape of industrial services, United Rentals, Inc. and Textron Inc. have showcased intriguing revenue trajectories over the past decade. From 2014 to 2024, United Rentals has seen a remarkable revenue growth of approximately 170%, surging from $5.7 billion to an impressive $15.3 billion. This growth underscores its strategic expansions and market adaptability.
Conversely, Textron Inc. has maintained a steady revenue stream, with a slight increase of around 1% from $13.9 billion in 2014 to $13.7 billion in 2024. Despite economic fluctuations, Textron's consistent performance highlights its resilience and diversified portfolio.
As we delve into these insights, it's evident that United Rentals' aggressive growth strategy has paid off, while Textron's stability offers a different kind of strength in the ever-evolving industrial sector.
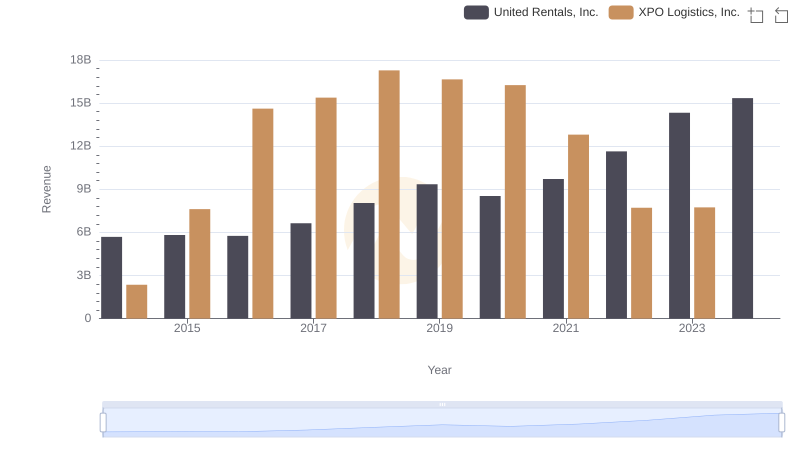
United Rentals, Inc. and XPO Logistics, Inc.: A Comprehensive Revenue Analysis
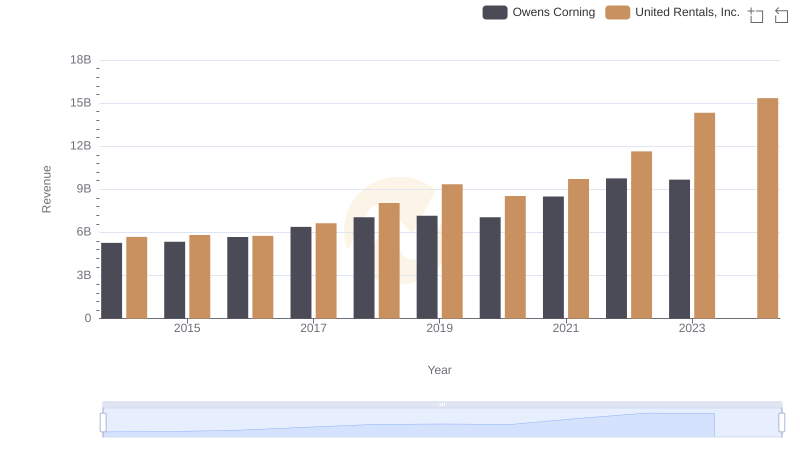
United Rentals, Inc. vs Owens Corning: Annual Revenue Growth Compared
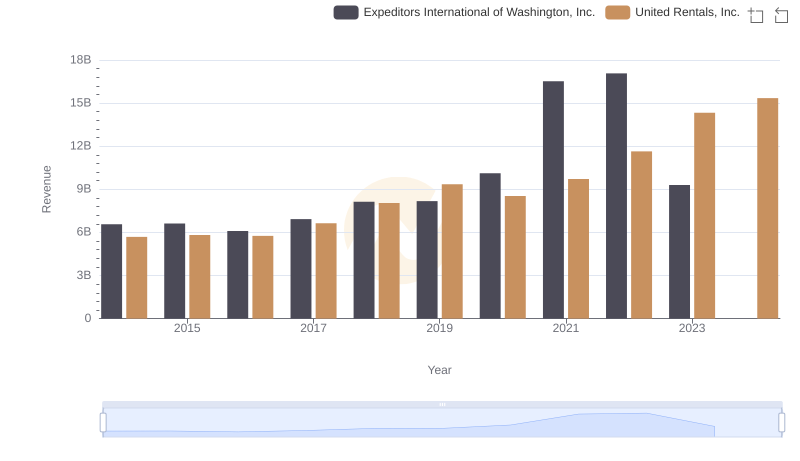
Comparing Revenue Performance: United Rentals, Inc. or Expeditors International of Washington, Inc.?
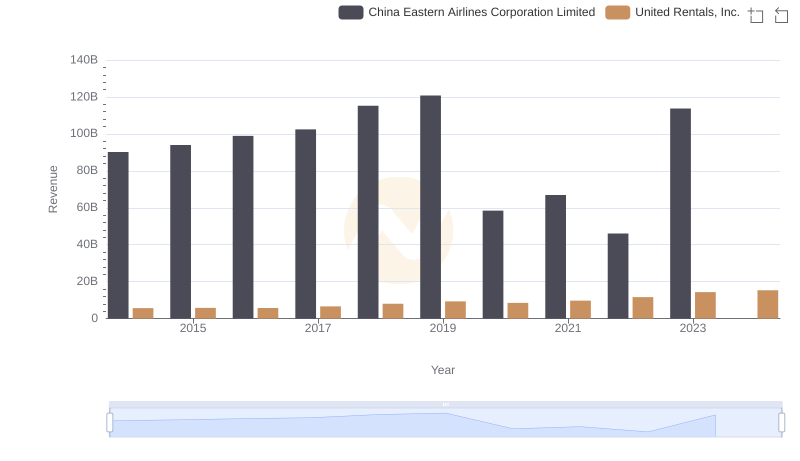
Revenue Insights: United Rentals, Inc. and China Eastern Airlines Corporation Limited Performance Compared
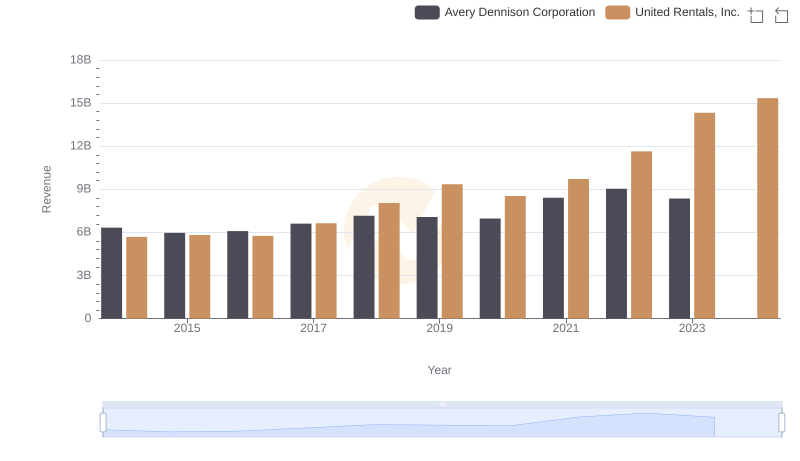
United Rentals, Inc. vs Avery Dennison Corporation: Examining Key Revenue Metrics
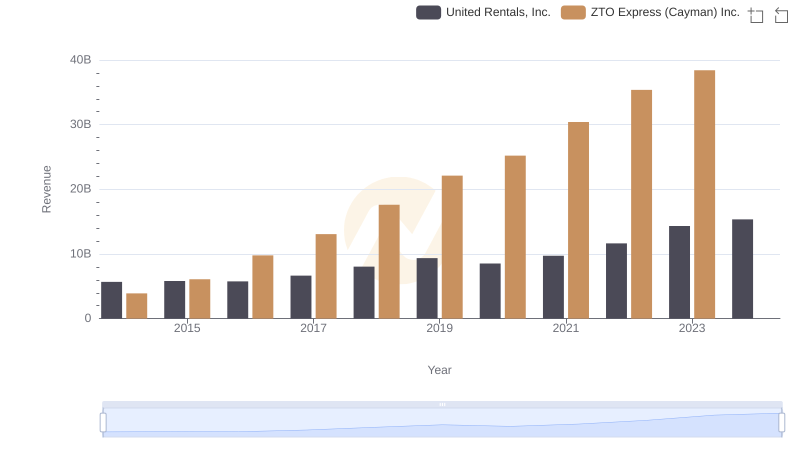
United Rentals, Inc. and ZTO Express (Cayman) Inc.: A Comprehensive Revenue Analysis
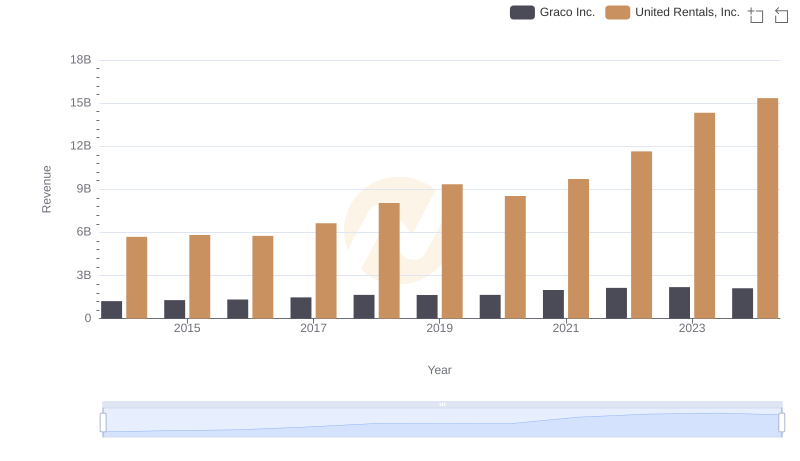
Who Generates More Revenue? United Rentals, Inc. or Graco Inc.
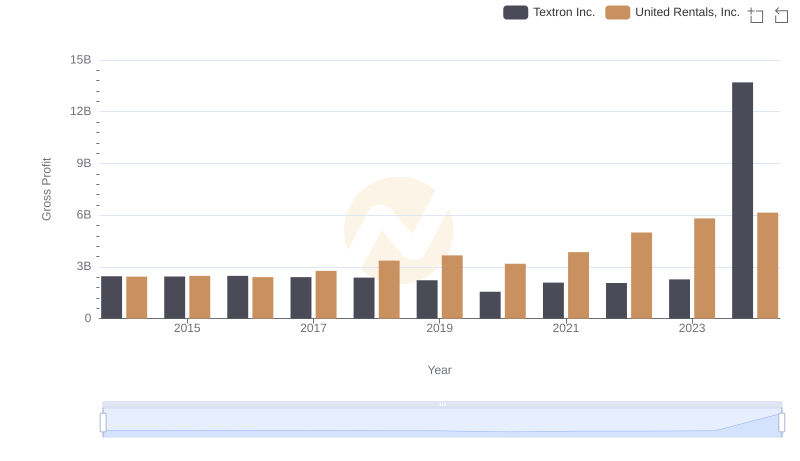
United Rentals, Inc. vs Textron Inc.: A Gross Profit Performance Breakdown
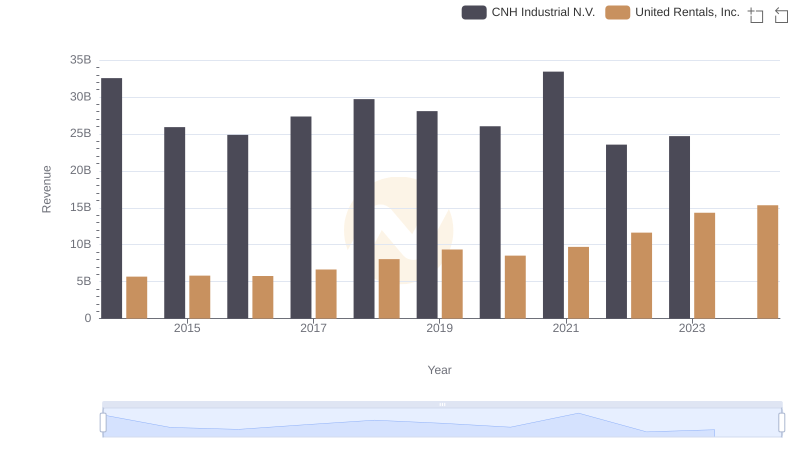
United Rentals, Inc. or CNH Industrial N.V.: Who Leads in Yearly Revenue?
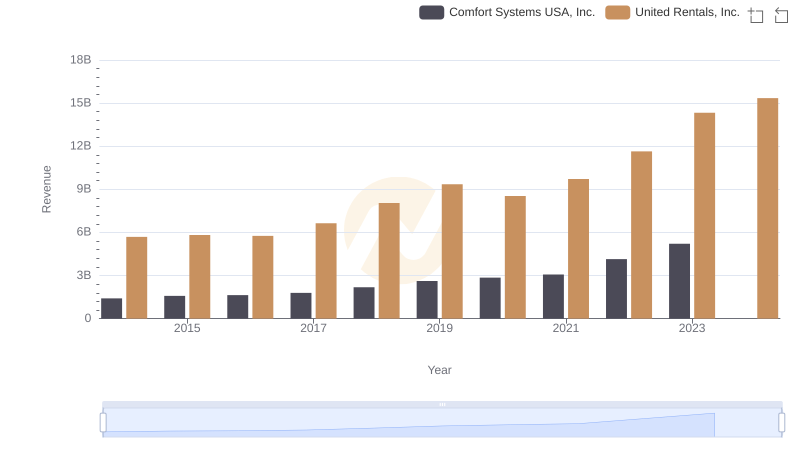
Breaking Down Revenue Trends: United Rentals, Inc. vs Comfort Systems USA, Inc.
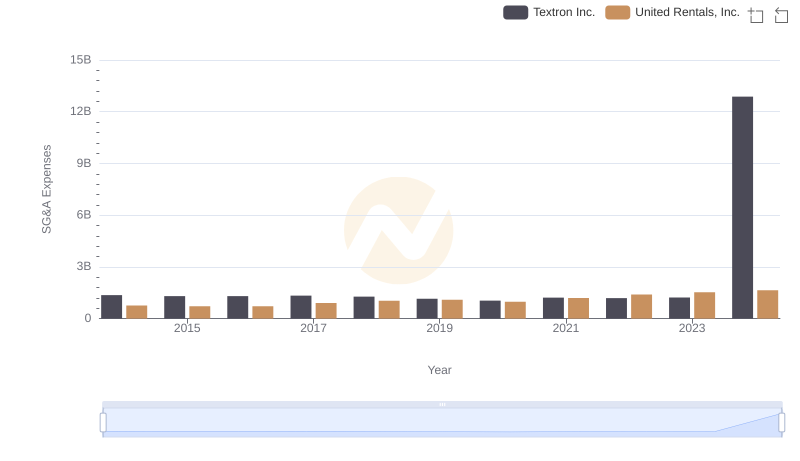
Comparing SG&A Expenses: United Rentals, Inc. vs Textron Inc. Trends and Insights
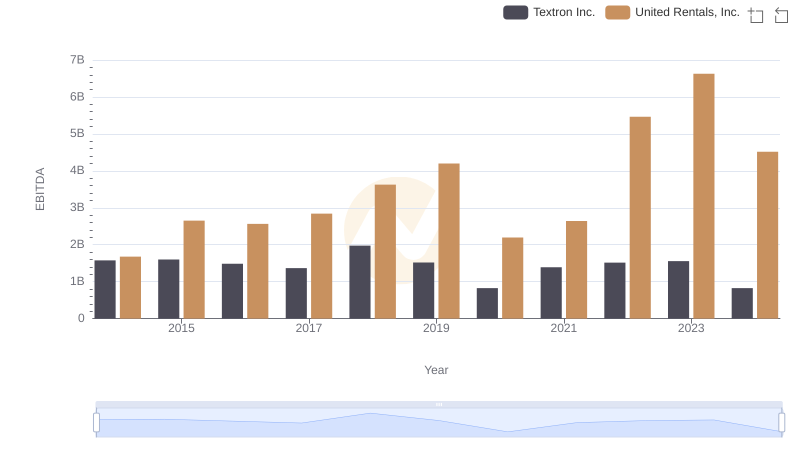
United Rentals, Inc. vs Textron Inc.: In-Depth EBITDA Performance Comparison