| __timestamp | Textron Inc. | United Rentals, Inc. |
|---|---|---|
| Wednesday, January 1, 2014 | 2457000000 | 2432000000 |
| Thursday, January 1, 2015 | 2444000000 | 2480000000 |
| Friday, January 1, 2016 | 2477000000 | 2403000000 |
| Sunday, January 1, 2017 | 2403000000 | 2769000000 |
| Monday, January 1, 2018 | 2378000000 | 3364000000 |
| Tuesday, January 1, 2019 | 2224000000 | 3670000000 |
| Wednesday, January 1, 2020 | 1557000000 | 3183000000 |
| Friday, January 1, 2021 | 2085000000 | 3853000000 |
| Saturday, January 1, 2022 | 2069000000 | 4996000000 |
| Sunday, January 1, 2023 | 2278000000 | 5813000000 |
| Monday, January 1, 2024 | 2502000000 | 6150000000 |
In pursuit of knowledge
In the competitive landscape of industrial giants, United Rentals, Inc. and Textron Inc. have showcased intriguing trends in gross profit over the past decade. From 2014 to 2023, United Rentals has consistently outperformed Textron, with a notable surge in 2023, achieving a gross profit of approximately $5.8 billion, a 140% increase from 2014. Textron, on the other hand, experienced a more modest growth, peaking in 2024 with a gross profit of around $13.7 billion, a significant leap from its 2014 figure. This performance analysis highlights United Rentals' robust growth trajectory, particularly post-2018, where it surpassed Textron's figures consistently. The data underscores the dynamic shifts in the industrial sector, with United Rentals capitalizing on market opportunities more effectively in recent years.
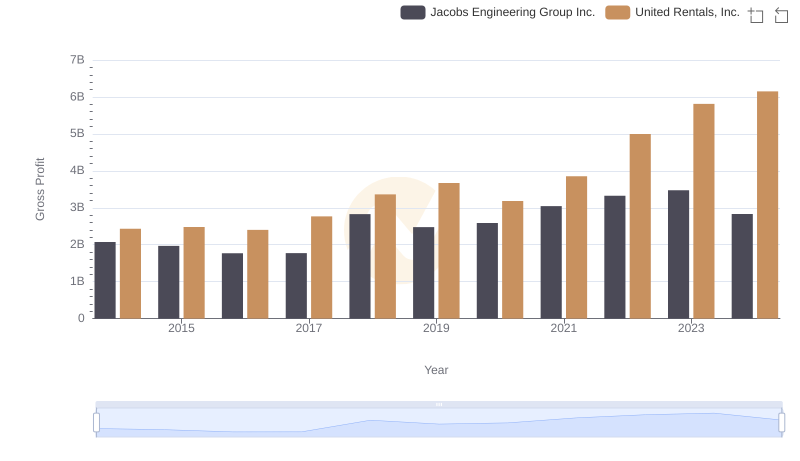
United Rentals, Inc. and Jacobs Engineering Group Inc.: A Detailed Gross Profit Analysis
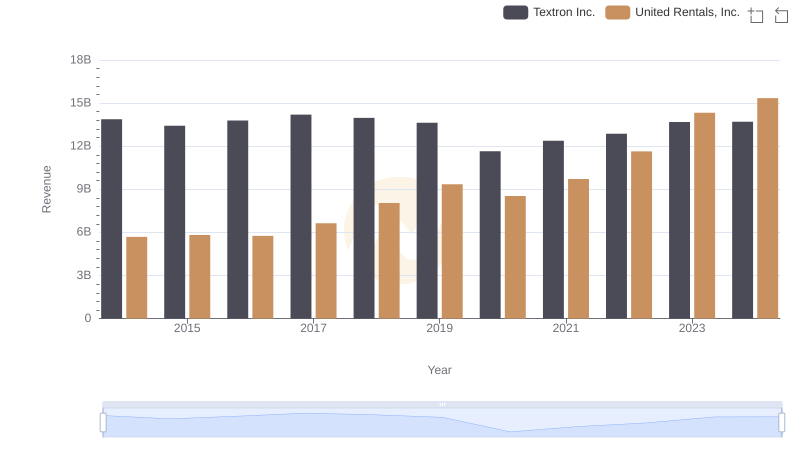
Revenue Insights: United Rentals, Inc. and Textron Inc. Performance Compared
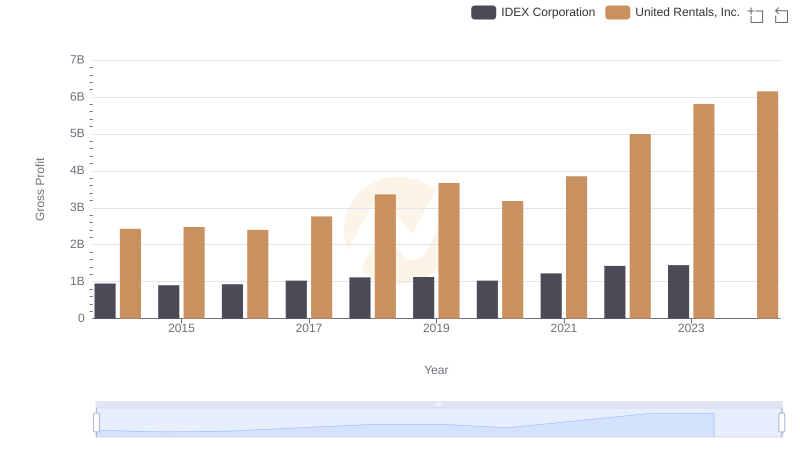
Gross Profit Analysis: Comparing United Rentals, Inc. and IDEX Corporation
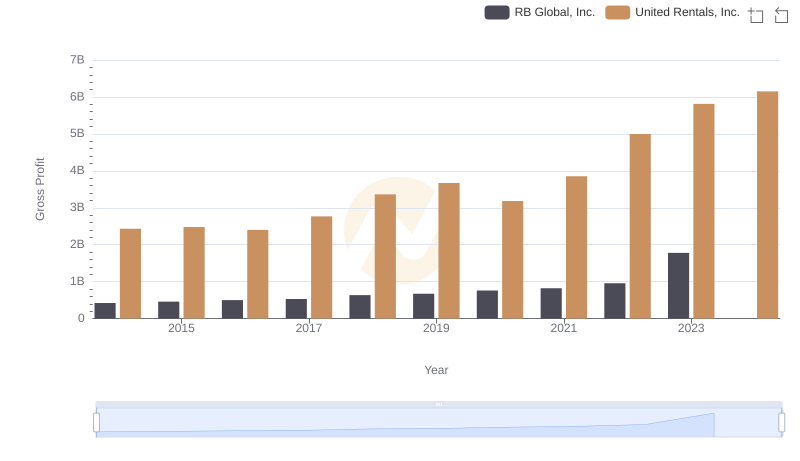
Who Generates Higher Gross Profit? United Rentals, Inc. or RB Global, Inc.
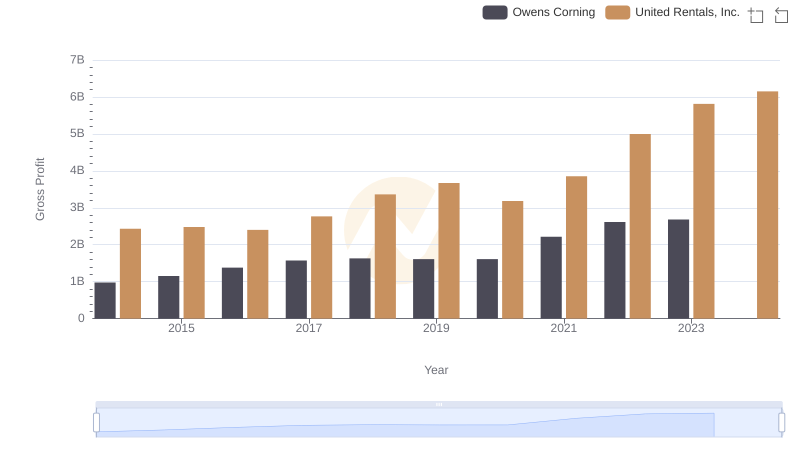
United Rentals, Inc. and Owens Corning: A Detailed Gross Profit Analysis
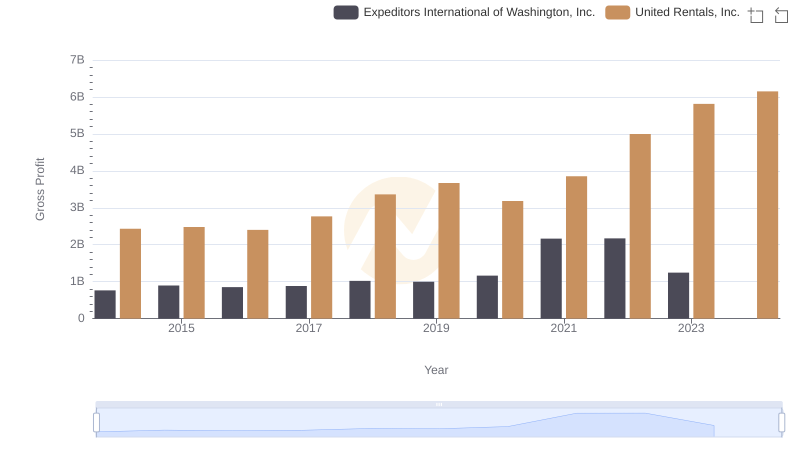
United Rentals, Inc. vs Expeditors International of Washington, Inc.: A Gross Profit Performance Breakdown
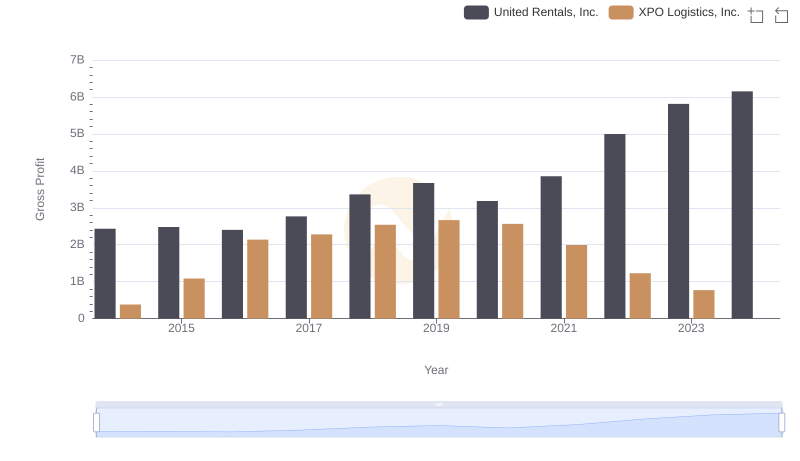
United Rentals, Inc. vs XPO Logistics, Inc.: A Gross Profit Performance Breakdown
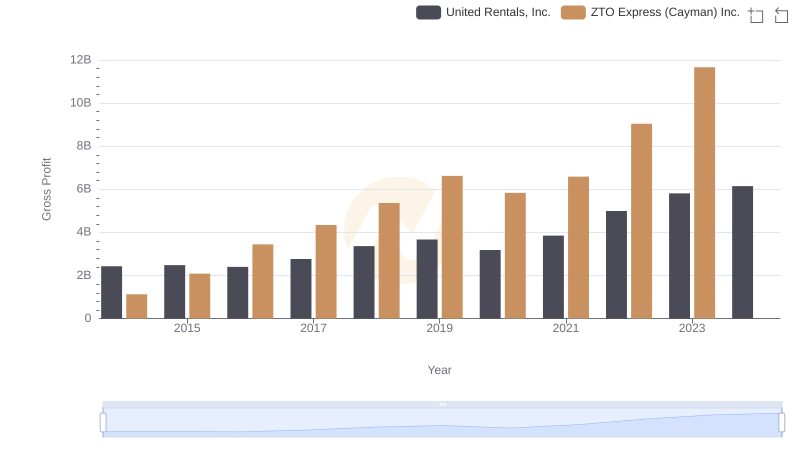
Gross Profit Comparison: United Rentals, Inc. and ZTO Express (Cayman) Inc. Trends

United Rentals, Inc. and Avery Dennison Corporation: A Detailed Gross Profit Analysis
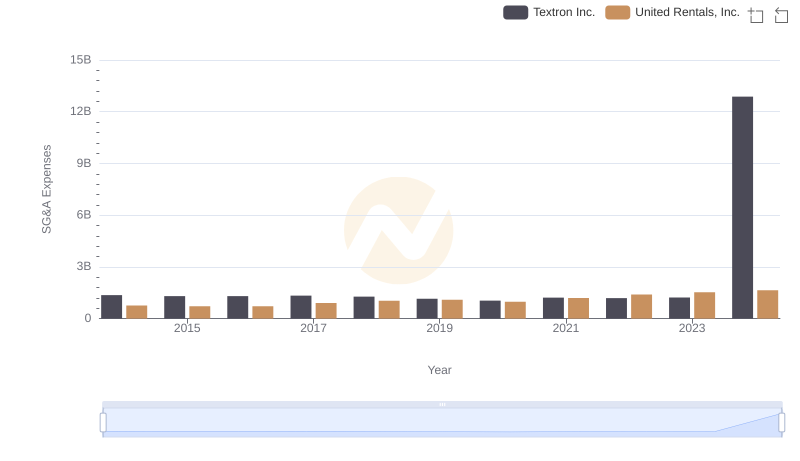
Comparing SG&A Expenses: United Rentals, Inc. vs Textron Inc. Trends and Insights
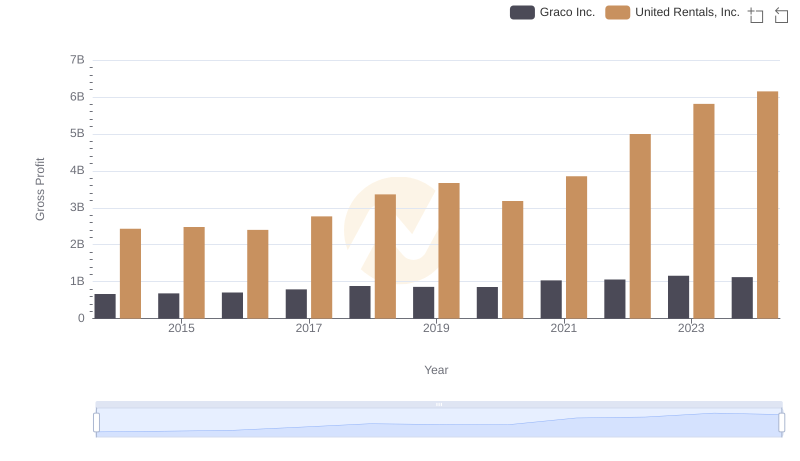
Gross Profit Comparison: United Rentals, Inc. and Graco Inc. Trends
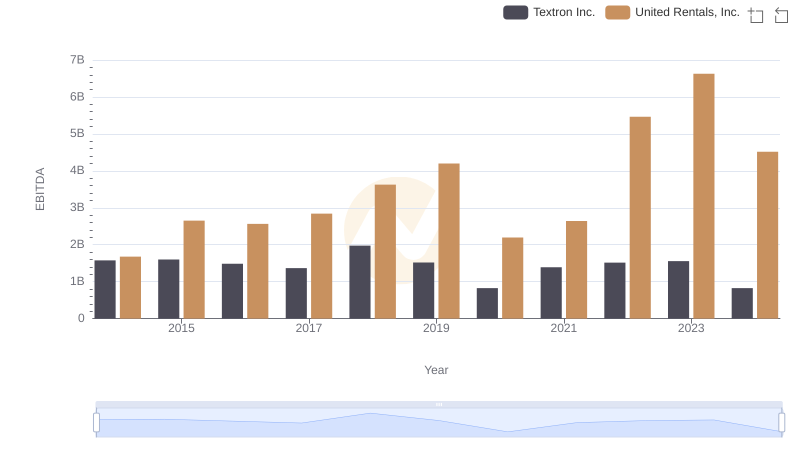
United Rentals, Inc. vs Textron Inc.: In-Depth EBITDA Performance Comparison